Immigrants from Russia vs Nonimmigrants Householder Income Ages 45 - 64 years
COMPARE
Immigrants from Russia
Nonimmigrants
Householder Income Ages 45 - 64 years
Householder Income Ages 45 - 64 years Comparison
Immigrants from Russia
Nonimmigrants
$113,215
HOUSEHOLDER INCOME AGES 45 - 64 YEARS
99.8/ 100
METRIC RATING
49th/ 347
METRIC RANK
$94,448
HOUSEHOLDER INCOME AGES 45 - 64 YEARS
5.0/ 100
METRIC RATING
223rd/ 347
METRIC RANK
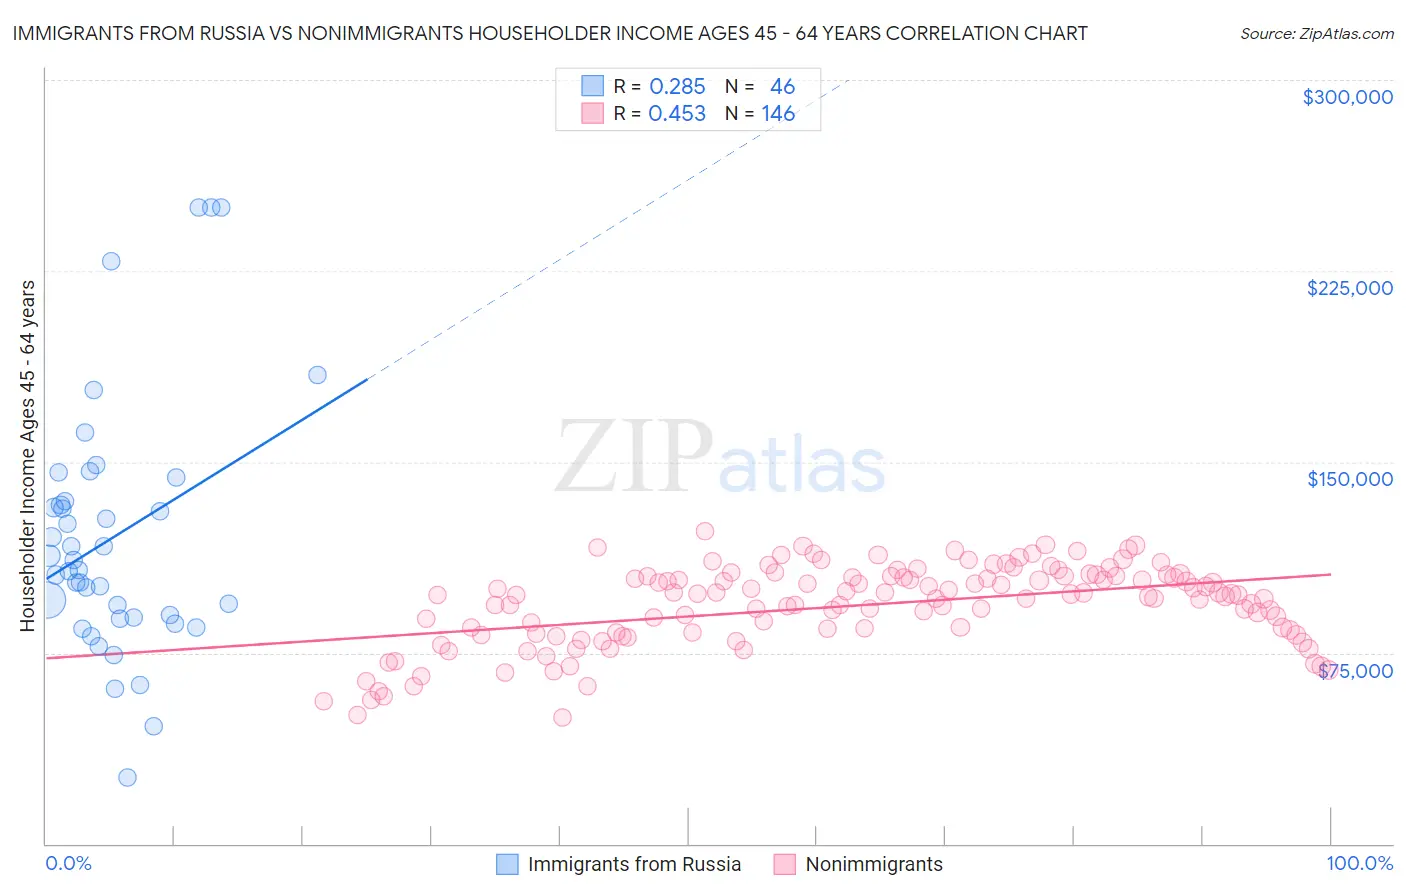
Immigrants from Russia vs Nonimmigrants Householder Income Ages 45 - 64 years Correlation Chart
The statistical analysis conducted on geographies consisting of 347,427,203 people shows a weak positive correlation between the proportion of Immigrants from Russia and household income with householder between the ages 45 and 64 in the United States with a correlation coefficient (R) of 0.285 and weighted average of $113,215. Similarly, the statistical analysis conducted on geographies consisting of 578,858,945 people shows a moderate positive correlation between the proportion of Nonimmigrants and household income with householder between the ages 45 and 64 in the United States with a correlation coefficient (R) of 0.453 and weighted average of $94,448, a difference of 19.9%.
Householder Income Ages 45 - 64 years Correlation Summary
| Measurement | Immigrants from Russia | Nonimmigrants |
| Minimum | $26,250 | $49,742 |
| Maximum | $250,001 | $122,626 |
| Range | $223,751 | $72,884 |
| Mean | $120,532 | $93,614 |
| Median | $109,623 | $97,642 |
| Interquartile 25% (IQ1) | $89,063 | $82,744 |
| Interquartile 75% (IQ3) | $134,641 | $104,952 |
| Interquartile Range (IQR) | $45,578 | $22,209 |
| Standard Deviation (Sample) | $49,965 | $15,816 |
| Standard Deviation (Population) | $49,419 | $15,762 |
Similar Demographics by Householder Income Ages 45 - 64 years
Demographics Similar to Immigrants from Russia by Householder Income Ages 45 - 64 years
In terms of householder income ages 45 - 64 years, the demographic groups most similar to Immigrants from Russia are Immigrants from Austria ($113,140, a difference of 0.070%), Immigrants from Indonesia ($113,519, a difference of 0.27%), Australian ($113,533, a difference of 0.28%), Immigrants from Greece ($113,548, a difference of 0.29%), and Immigrants from South Africa ($112,886, a difference of 0.29%).
| Demographics | Rating | Rank | Householder Income Ages 45 - 64 years |
| Estonians | 99.9 /100 | #42 | Exceptional $114,220 |
| Israelis | 99.9 /100 | #43 | Exceptional $114,186 |
| Bulgarians | 99.9 /100 | #44 | Exceptional $113,883 |
| Immigrants | France | 99.9 /100 | #45 | Exceptional $113,680 |
| Immigrants | Greece | 99.9 /100 | #46 | Exceptional $113,548 |
| Australians | 99.9 /100 | #47 | Exceptional $113,533 |
| Immigrants | Indonesia | 99.9 /100 | #48 | Exceptional $113,519 |
| Immigrants | Russia | 99.8 /100 | #49 | Exceptional $113,215 |
| Immigrants | Austria | 99.8 /100 | #50 | Exceptional $113,140 |
| Immigrants | South Africa | 99.8 /100 | #51 | Exceptional $112,886 |
| Immigrants | Malaysia | 99.8 /100 | #52 | Exceptional $112,796 |
| Afghans | 99.8 /100 | #53 | Exceptional $112,676 |
| Greeks | 99.8 /100 | #54 | Exceptional $112,630 |
| Lithuanians | 99.8 /100 | #55 | Exceptional $112,484 |
| Egyptians | 99.7 /100 | #56 | Exceptional $112,256 |
Demographics Similar to Nonimmigrants by Householder Income Ages 45 - 64 years
In terms of householder income ages 45 - 64 years, the demographic groups most similar to Nonimmigrants are Malaysian ($94,517, a difference of 0.070%), Immigrants from Bosnia and Herzegovina ($94,288, a difference of 0.17%), Bermudan ($94,197, a difference of 0.27%), Immigrants from the Azores ($94,138, a difference of 0.33%), and Immigrants from Nigeria ($94,804, a difference of 0.38%).
| Demographics | Rating | Rank | Householder Income Ages 45 - 64 years |
| Immigrants | Venezuela | 7.6 /100 | #216 | Tragic $95,342 |
| Immigrants | Ghana | 6.4 /100 | #217 | Tragic $94,982 |
| Delaware | 6.2 /100 | #218 | Tragic $94,914 |
| Immigrants | Armenia | 6.1 /100 | #219 | Tragic $94,863 |
| Salvadorans | 6.0 /100 | #220 | Tragic $94,842 |
| Immigrants | Nigeria | 5.9 /100 | #221 | Tragic $94,804 |
| Malaysians | 5.2 /100 | #222 | Tragic $94,517 |
| Immigrants | Nonimmigrants | 5.0 /100 | #223 | Tragic $94,448 |
| Immigrants | Bosnia and Herzegovina | 4.6 /100 | #224 | Tragic $94,288 |
| Bermudans | 4.4 /100 | #225 | Tragic $94,197 |
| Immigrants | Azores | 4.3 /100 | #226 | Tragic $94,138 |
| Alaska Natives | 4.0 /100 | #227 | Tragic $93,991 |
| Immigrants | Panama | 3.7 /100 | #228 | Tragic $93,815 |
| Vietnamese | 3.6 /100 | #229 | Tragic $93,788 |
| Immigrants | Sudan | 3.6 /100 | #230 | Tragic $93,781 |