Immigrants from Bangladesh vs Nonimmigrants Householder Income Ages 45 - 64 years
COMPARE
Immigrants from Bangladesh
Nonimmigrants
Householder Income Ages 45 - 64 years
Householder Income Ages 45 - 64 years Comparison
Immigrants from Bangladesh
Nonimmigrants
$92,208
HOUSEHOLDER INCOME AGES 45 - 64 YEARS
1.7/ 100
METRIC RATING
237th/ 347
METRIC RANK
$94,448
HOUSEHOLDER INCOME AGES 45 - 64 YEARS
5.0/ 100
METRIC RATING
223rd/ 347
METRIC RANK
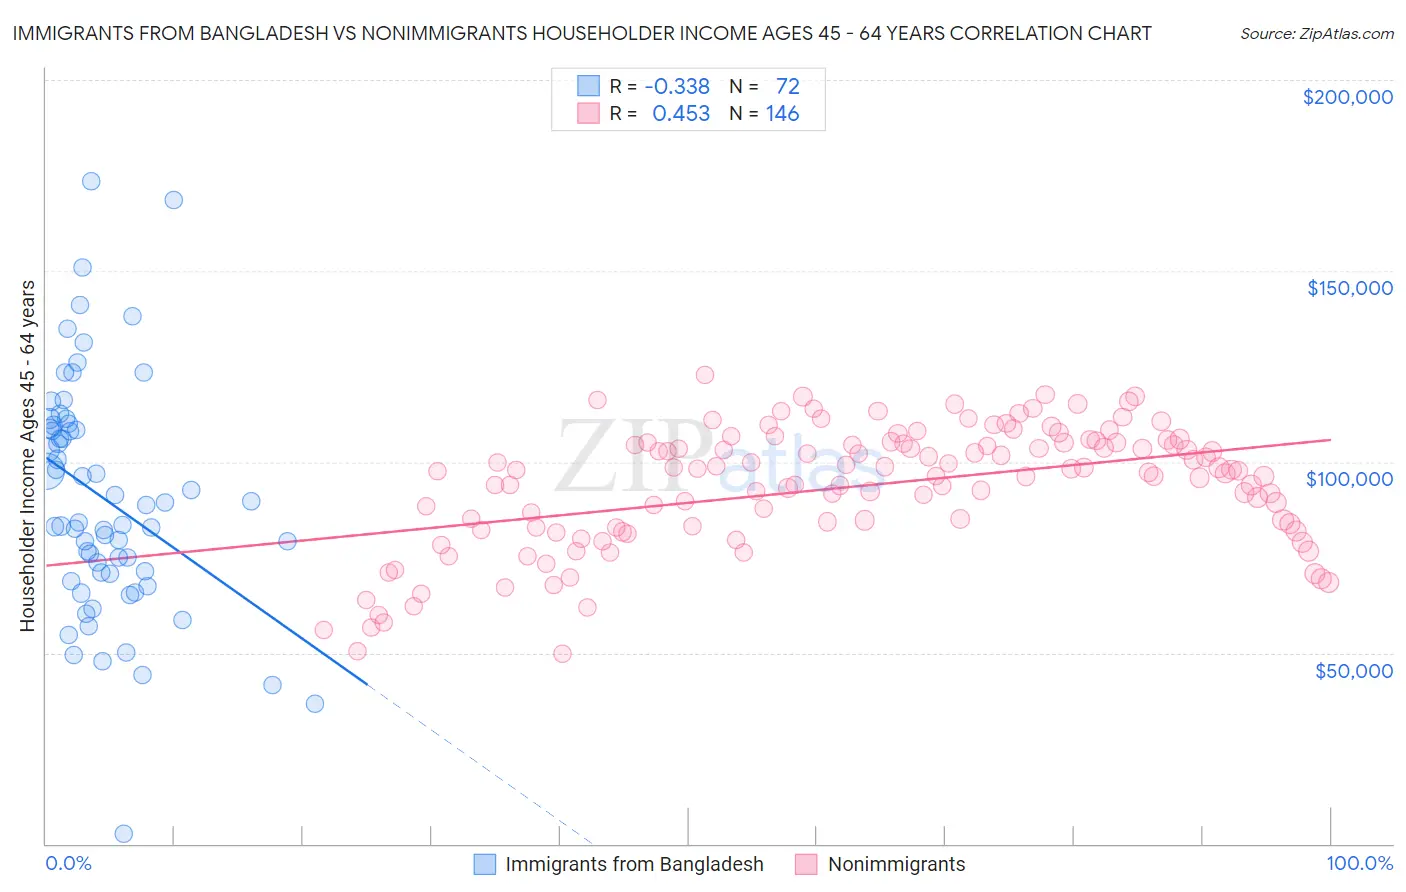
Immigrants from Bangladesh vs Nonimmigrants Householder Income Ages 45 - 64 years Correlation Chart
The statistical analysis conducted on geographies consisting of 203,437,833 people shows a mild negative correlation between the proportion of Immigrants from Bangladesh and household income with householder between the ages 45 and 64 in the United States with a correlation coefficient (R) of -0.338 and weighted average of $92,208. Similarly, the statistical analysis conducted on geographies consisting of 578,858,945 people shows a moderate positive correlation between the proportion of Nonimmigrants and household income with householder between the ages 45 and 64 in the United States with a correlation coefficient (R) of 0.453 and weighted average of $94,448, a difference of 2.4%.
Householder Income Ages 45 - 64 years Correlation Summary
| Measurement | Immigrants from Bangladesh | Nonimmigrants |
| Minimum | $2,499 | $49,742 |
| Maximum | $173,347 | $122,626 |
| Range | $170,848 | $72,884 |
| Mean | $90,304 | $93,614 |
| Median | $86,504 | $97,642 |
| Interquartile 25% (IQ1) | $70,928 | $82,744 |
| Interquartile 75% (IQ3) | $109,175 | $104,952 |
| Interquartile Range (IQR) | $38,247 | $22,209 |
| Standard Deviation (Sample) | $30,699 | $15,816 |
| Standard Deviation (Population) | $30,485 | $15,762 |
Demographics Similar to Immigrants from Bangladesh and Nonimmigrants by Householder Income Ages 45 - 64 years
In terms of householder income ages 45 - 64 years, the demographic groups most similar to Immigrants from Bangladesh are Immigrants from Western Africa ($92,384, a difference of 0.19%), Pennsylvania German ($91,956, a difference of 0.27%), Nicaraguan ($92,554, a difference of 0.37%), Immigrants from Ecuador ($91,462, a difference of 0.82%), and Immigrants from Burma/Myanmar ($91,385, a difference of 0.90%). Similarly, the demographic groups most similar to Nonimmigrants are Malaysian ($94,517, a difference of 0.070%), Immigrants from Bosnia and Herzegovina ($94,288, a difference of 0.17%), Bermudan ($94,197, a difference of 0.27%), Immigrants from the Azores ($94,138, a difference of 0.33%), and Immigrants from Nigeria ($94,804, a difference of 0.38%).
| Demographics | Rating | Rank | Householder Income Ages 45 - 64 years |
| Salvadorans | 6.0 /100 | #220 | Tragic $94,842 |
| Immigrants | Nigeria | 5.9 /100 | #221 | Tragic $94,804 |
| Malaysians | 5.2 /100 | #222 | Tragic $94,517 |
| Immigrants | Nonimmigrants | 5.0 /100 | #223 | Tragic $94,448 |
| Immigrants | Bosnia and Herzegovina | 4.6 /100 | #224 | Tragic $94,288 |
| Bermudans | 4.4 /100 | #225 | Tragic $94,197 |
| Immigrants | Azores | 4.3 /100 | #226 | Tragic $94,138 |
| Alaska Natives | 4.0 /100 | #227 | Tragic $93,991 |
| Immigrants | Panama | 3.7 /100 | #228 | Tragic $93,815 |
| Vietnamese | 3.6 /100 | #229 | Tragic $93,788 |
| Immigrants | Sudan | 3.6 /100 | #230 | Tragic $93,781 |
| Ecuadorians | 3.6 /100 | #231 | Tragic $93,739 |
| Sudanese | 3.5 /100 | #232 | Tragic $93,718 |
| Nepalese | 3.0 /100 | #233 | Tragic $93,355 |
| Immigrants | El Salvador | 2.7 /100 | #234 | Tragic $93,176 |
| Nicaraguans | 2.0 /100 | #235 | Tragic $92,554 |
| Immigrants | Western Africa | 1.8 /100 | #236 | Tragic $92,384 |
| Immigrants | Bangladesh | 1.7 /100 | #237 | Tragic $92,208 |
| Pennsylvania Germans | 1.5 /100 | #238 | Tragic $91,956 |
| Immigrants | Ecuador | 1.2 /100 | #239 | Tragic $91,462 |
| Immigrants | Burma/Myanmar | 1.1 /100 | #240 | Tragic $91,385 |