Immigrants from Russia vs Egyptian Householder Income Ages 45 - 64 years
COMPARE
Immigrants from Russia
Egyptian
Householder Income Ages 45 - 64 years
Householder Income Ages 45 - 64 years Comparison
Immigrants from Russia
Egyptians
$113,215
HOUSEHOLDER INCOME AGES 45 - 64 YEARS
99.8/ 100
METRIC RATING
49th/ 347
METRIC RANK
$112,256
HOUSEHOLDER INCOME AGES 45 - 64 YEARS
99.7/ 100
METRIC RATING
56th/ 347
METRIC RANK
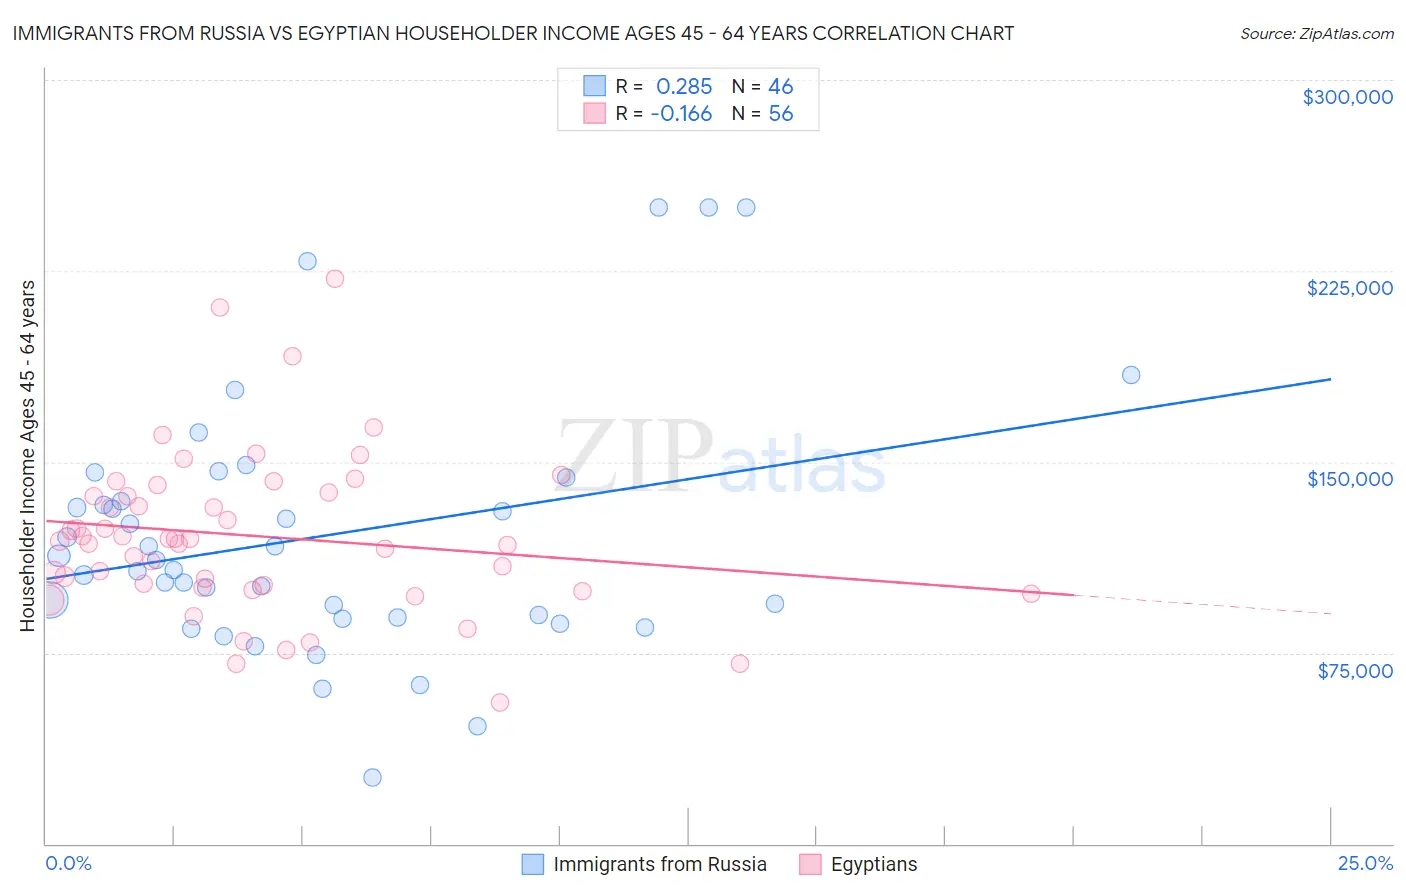
Immigrants from Russia vs Egyptian Householder Income Ages 45 - 64 years Correlation Chart
The statistical analysis conducted on geographies consisting of 347,427,203 people shows a weak positive correlation between the proportion of Immigrants from Russia and household income with householder between the ages 45 and 64 in the United States with a correlation coefficient (R) of 0.285 and weighted average of $113,215. Similarly, the statistical analysis conducted on geographies consisting of 276,614,295 people shows a poor negative correlation between the proportion of Egyptians and household income with householder between the ages 45 and 64 in the United States with a correlation coefficient (R) of -0.166 and weighted average of $112,256, a difference of 0.85%.
Householder Income Ages 45 - 64 years Correlation Summary
| Measurement | Immigrants from Russia | Egyptian |
| Minimum | $26,250 | $55,625 |
| Maximum | $250,001 | $221,912 |
| Range | $223,751 | $166,287 |
| Mean | $120,532 | $120,908 |
| Median | $109,623 | $119,250 |
| Interquartile 25% (IQ1) | $89,063 | $101,192 |
| Interquartile 75% (IQ3) | $134,641 | $137,363 |
| Interquartile Range (IQR) | $45,578 | $36,171 |
| Standard Deviation (Sample) | $49,965 | $31,748 |
| Standard Deviation (Population) | $49,419 | $31,463 |
Demographics Similar to Immigrants from Russia and Egyptians by Householder Income Ages 45 - 64 years
In terms of householder income ages 45 - 64 years, the demographic groups most similar to Immigrants from Russia are Immigrants from Austria ($113,140, a difference of 0.070%), Immigrants from Indonesia ($113,519, a difference of 0.27%), Australian ($113,533, a difference of 0.28%), Immigrants from Greece ($113,548, a difference of 0.29%), and Immigrants from South Africa ($112,886, a difference of 0.29%). Similarly, the demographic groups most similar to Egyptians are Immigrants from Scotland ($112,175, a difference of 0.070%), Lithuanian ($112,484, a difference of 0.20%), Soviet Union ($112,008, a difference of 0.22%), Immigrants from Europe ($111,984, a difference of 0.24%), and Immigrants from Netherlands ($111,982, a difference of 0.24%).
| Demographics | Rating | Rank | Householder Income Ages 45 - 64 years |
| Estonians | 99.9 /100 | #42 | Exceptional $114,220 |
| Israelis | 99.9 /100 | #43 | Exceptional $114,186 |
| Bulgarians | 99.9 /100 | #44 | Exceptional $113,883 |
| Immigrants | France | 99.9 /100 | #45 | Exceptional $113,680 |
| Immigrants | Greece | 99.9 /100 | #46 | Exceptional $113,548 |
| Australians | 99.9 /100 | #47 | Exceptional $113,533 |
| Immigrants | Indonesia | 99.9 /100 | #48 | Exceptional $113,519 |
| Immigrants | Russia | 99.8 /100 | #49 | Exceptional $113,215 |
| Immigrants | Austria | 99.8 /100 | #50 | Exceptional $113,140 |
| Immigrants | South Africa | 99.8 /100 | #51 | Exceptional $112,886 |
| Immigrants | Malaysia | 99.8 /100 | #52 | Exceptional $112,796 |
| Afghans | 99.8 /100 | #53 | Exceptional $112,676 |
| Greeks | 99.8 /100 | #54 | Exceptional $112,630 |
| Lithuanians | 99.8 /100 | #55 | Exceptional $112,484 |
| Egyptians | 99.7 /100 | #56 | Exceptional $112,256 |
| Immigrants | Scotland | 99.7 /100 | #57 | Exceptional $112,175 |
| Soviet Union | 99.7 /100 | #58 | Exceptional $112,008 |
| Immigrants | Europe | 99.7 /100 | #59 | Exceptional $111,984 |
| Immigrants | Netherlands | 99.7 /100 | #60 | Exceptional $111,982 |
| Immigrants | Czechoslovakia | 99.7 /100 | #61 | Exceptional $111,914 |
| Immigrants | Norway | 99.7 /100 | #62 | Exceptional $111,669 |