Immigrants from Russia vs Luxembourger Householder Income Under 25 years
COMPARE
Immigrants from Russia
Luxembourger
Householder Income Under 25 years
Householder Income Under 25 years Comparison
Immigrants from Russia
Luxembourgers
$55,891
HOUSEHOLDER INCOME UNDER 25 YEARS
100.0/ 100
METRIC RATING
37th/ 347
METRIC RANK
$50,379
HOUSEHOLDER INCOME UNDER 25 YEARS
1.2/ 100
METRIC RATING
254th/ 347
METRIC RANK
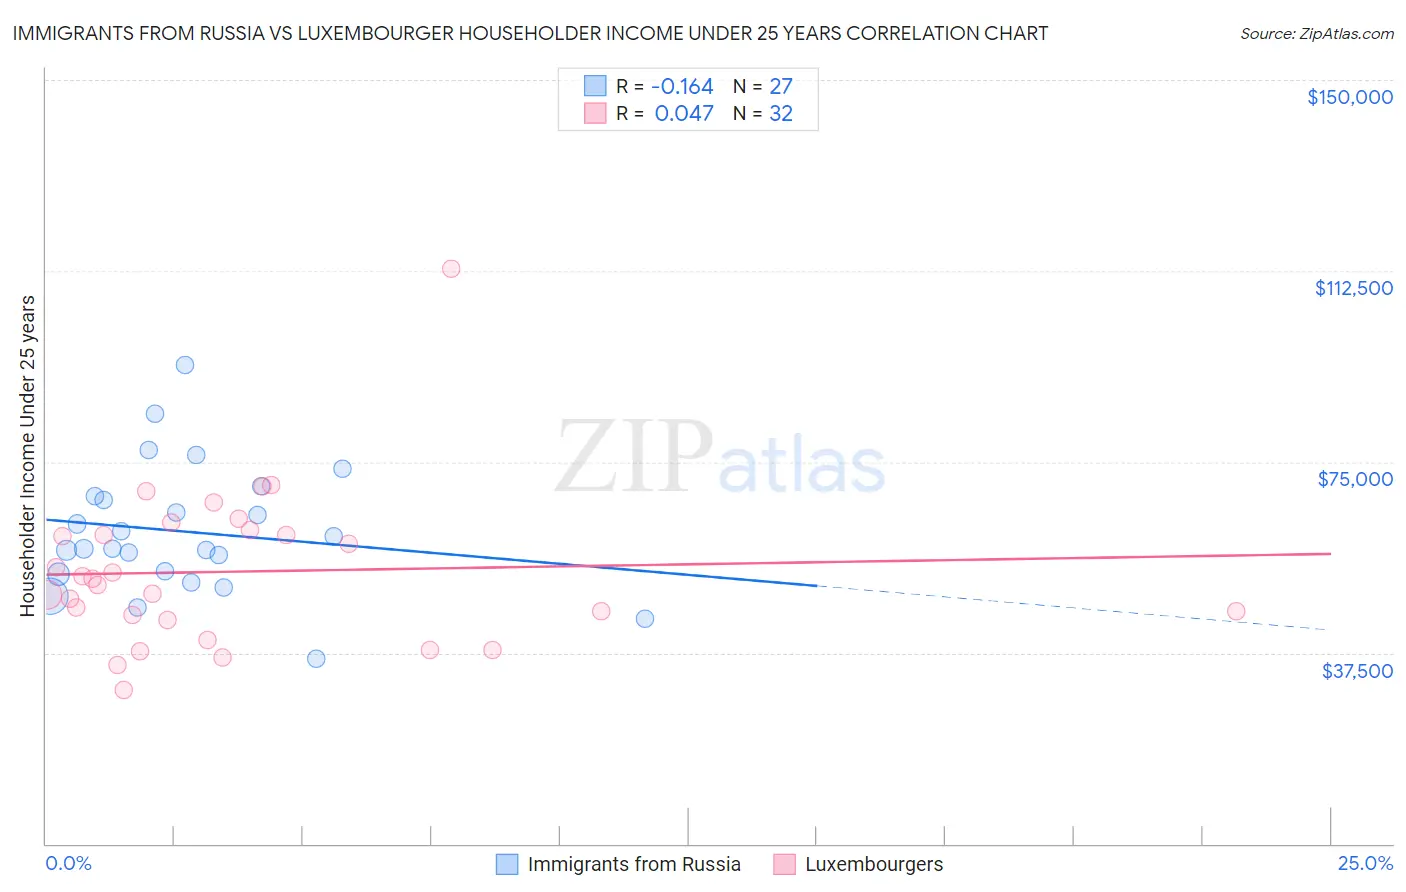
Immigrants from Russia vs Luxembourger Householder Income Under 25 years Correlation Chart
The statistical analysis conducted on geographies consisting of 295,410,688 people shows a poor negative correlation between the proportion of Immigrants from Russia and household income with householder under the age of 25 in the United States with a correlation coefficient (R) of -0.164 and weighted average of $55,891. Similarly, the statistical analysis conducted on geographies consisting of 133,229,514 people shows no correlation between the proportion of Luxembourgers and household income with householder under the age of 25 in the United States with a correlation coefficient (R) of 0.047 and weighted average of $50,379, a difference of 10.9%.
Householder Income Under 25 years Correlation Summary
| Measurement | Immigrants from Russia | Luxembourger |
| Minimum | $36,250 | $30,181 |
| Maximum | $93,974 | $112,908 |
| Range | $57,724 | $82,726 |
| Mean | $61,278 | $53,440 |
| Median | $57,969 | $51,427 |
| Interquartile 25% (IQ1) | $52,911 | $44,462 |
| Interquartile 75% (IQ3) | $68,185 | $61,145 |
| Interquartile Range (IQR) | $15,274 | $16,682 |
| Standard Deviation (Sample) | $12,683 | $15,505 |
| Standard Deviation (Population) | $12,446 | $15,261 |
Similar Demographics by Householder Income Under 25 years
Demographics Similar to Immigrants from Russia by Householder Income Under 25 years
In terms of householder income under 25 years, the demographic groups most similar to Immigrants from Russia are Immigrants from Iran ($55,880, a difference of 0.020%), Tlingit-Haida ($55,914, a difference of 0.040%), Immigrants from Israel ($55,913, a difference of 0.040%), Immigrants from Japan ($55,932, a difference of 0.070%), and Inupiat ($55,935, a difference of 0.080%).
| Demographics | Rating | Rank | Householder Income Under 25 years |
| Immigrants | Moldova | 100.0 /100 | #30 | Exceptional $56,168 |
| Vietnamese | 100.0 /100 | #31 | Exceptional $56,127 |
| Peruvians | 100.0 /100 | #32 | Exceptional $56,052 |
| Inupiat | 100.0 /100 | #33 | Exceptional $55,935 |
| Immigrants | Japan | 100.0 /100 | #34 | Exceptional $55,932 |
| Tlingit-Haida | 100.0 /100 | #35 | Exceptional $55,914 |
| Immigrants | Israel | 100.0 /100 | #36 | Exceptional $55,913 |
| Immigrants | Russia | 100.0 /100 | #37 | Exceptional $55,891 |
| Immigrants | Iran | 100.0 /100 | #38 | Exceptional $55,880 |
| Immigrants | Belarus | 100.0 /100 | #39 | Exceptional $55,743 |
| Immigrants | Greece | 100.0 /100 | #40 | Exceptional $55,727 |
| Immigrants | Guyana | 100.0 /100 | #41 | Exceptional $55,726 |
| Immigrants | Korea | 100.0 /100 | #42 | Exceptional $55,716 |
| Immigrants | South Eastern Asia | 100.0 /100 | #43 | Exceptional $55,714 |
| Paraguayans | 100.0 /100 | #44 | Exceptional $55,614 |
Demographics Similar to Luxembourgers by Householder Income Under 25 years
In terms of householder income under 25 years, the demographic groups most similar to Luxembourgers are Aleut ($50,377, a difference of 0.010%), Immigrants from Cuba ($50,374, a difference of 0.010%), Immigrants from Haiti ($50,398, a difference of 0.040%), Lebanese ($50,355, a difference of 0.050%), and Immigrants from Mexico ($50,422, a difference of 0.080%).
| Demographics | Rating | Rank | Householder Income Under 25 years |
| Immigrants | Bosnia and Herzegovina | 1.8 /100 | #247 | Tragic $50,565 |
| Slavs | 1.8 /100 | #248 | Tragic $50,563 |
| Scottish | 1.8 /100 | #249 | Tragic $50,554 |
| Immigrants | Cabo Verde | 1.7 /100 | #250 | Tragic $50,520 |
| Celtics | 1.4 /100 | #251 | Tragic $50,447 |
| Immigrants | Mexico | 1.3 /100 | #252 | Tragic $50,422 |
| Immigrants | Haiti | 1.2 /100 | #253 | Tragic $50,398 |
| Luxembourgers | 1.2 /100 | #254 | Tragic $50,379 |
| Aleuts | 1.2 /100 | #255 | Tragic $50,377 |
| Immigrants | Cuba | 1.2 /100 | #256 | Tragic $50,374 |
| Lebanese | 1.1 /100 | #257 | Tragic $50,355 |
| Whites/Caucasians | 1.1 /100 | #258 | Tragic $50,336 |
| Immigrants | Dominica | 1.0 /100 | #259 | Tragic $50,301 |
| Hispanics or Latinos | 0.9 /100 | #260 | Tragic $50,279 |
| Hungarians | 0.9 /100 | #261 | Tragic $50,247 |