Immigrants from Russia vs Welsh Householder Income Over 65 years
COMPARE
Immigrants from Russia
Welsh
Householder Income Over 65 years
Householder Income Over 65 years Comparison
Immigrants from Russia
Welsh
$64,512
HOUSEHOLDER INCOME OVER 65 YEARS
97.6/ 100
METRIC RATING
86th/ 347
METRIC RANK
$60,666
HOUSEHOLDER INCOME OVER 65 YEARS
42.2/ 100
METRIC RATING
179th/ 347
METRIC RANK
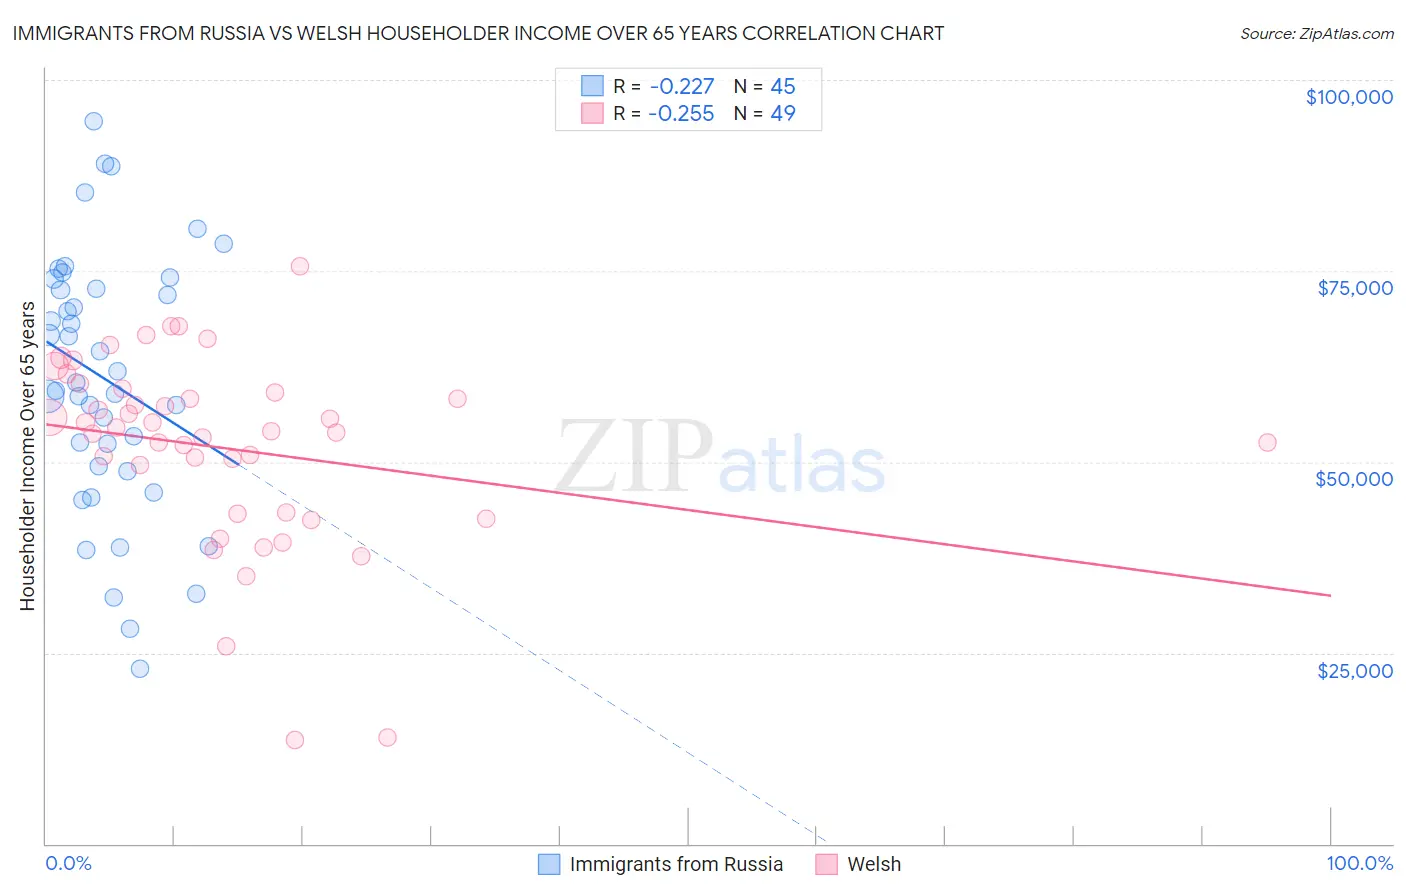
Immigrants from Russia vs Welsh Householder Income Over 65 years Correlation Chart
The statistical analysis conducted on geographies consisting of 346,854,192 people shows a weak negative correlation between the proportion of Immigrants from Russia and household income with householder over the age of 65 in the United States with a correlation coefficient (R) of -0.227 and weighted average of $64,512. Similarly, the statistical analysis conducted on geographies consisting of 525,240,397 people shows a weak negative correlation between the proportion of Welsh and household income with householder over the age of 65 in the United States with a correlation coefficient (R) of -0.255 and weighted average of $60,666, a difference of 6.3%.
Householder Income Over 65 years Correlation Summary
| Measurement | Immigrants from Russia | Welsh |
| Minimum | $22,832 | $13,664 |
| Maximum | $94,608 | $75,625 |
| Range | $71,776 | $61,961 |
| Mean | $60,780 | $51,794 |
| Median | $60,464 | $53,958 |
| Interquartile 25% (IQ1) | $49,102 | $43,354 |
| Interquartile 75% (IQ3) | $73,303 | $59,278 |
| Interquartile Range (IQR) | $24,201 | $15,924 |
| Standard Deviation (Sample) | $16,899 | $12,598 |
| Standard Deviation (Population) | $16,710 | $12,468 |
Similar Demographics by Householder Income Over 65 years
Demographics Similar to Immigrants from Russia by Householder Income Over 65 years
In terms of householder income over 65 years, the demographic groups most similar to Immigrants from Russia are Immigrants from Lebanon ($64,521, a difference of 0.010%), Austrian ($64,470, a difference of 0.070%), Immigrants from Romania ($64,462, a difference of 0.080%), Paraguayan ($64,443, a difference of 0.11%), and Immigrants from Kuwait ($64,433, a difference of 0.12%).
| Demographics | Rating | Rank | Householder Income Over 65 years |
| Hawaiians | 98.4 /100 | #79 | Exceptional $64,920 |
| Immigrants | North America | 98.3 /100 | #80 | Exceptional $64,856 |
| Immigrants | Europe | 98.3 /100 | #81 | Exceptional $64,828 |
| Immigrants | Fiji | 98.2 /100 | #82 | Exceptional $64,795 |
| Northern Europeans | 97.9 /100 | #83 | Exceptional $64,658 |
| Immigrants | Greece | 97.9 /100 | #84 | Exceptional $64,636 |
| Immigrants | Lebanon | 97.6 /100 | #85 | Exceptional $64,521 |
| Immigrants | Russia | 97.6 /100 | #86 | Exceptional $64,512 |
| Austrians | 97.5 /100 | #87 | Exceptional $64,470 |
| Immigrants | Romania | 97.5 /100 | #88 | Exceptional $64,462 |
| Paraguayans | 97.4 /100 | #89 | Exceptional $64,443 |
| Immigrants | Kuwait | 97.4 /100 | #90 | Exceptional $64,433 |
| Immigrants | Oceania | 97.4 /100 | #91 | Exceptional $64,416 |
| Immigrants | Bulgaria | 97.3 /100 | #92 | Exceptional $64,379 |
| Jordanians | 97.1 /100 | #93 | Exceptional $64,313 |
Demographics Similar to Welsh by Householder Income Over 65 years
In terms of householder income over 65 years, the demographic groups most similar to Welsh are Immigrants from Morocco ($60,647, a difference of 0.030%), Yup'ik ($60,727, a difference of 0.10%), Celtic ($60,608, a difference of 0.10%), Alaska Native ($60,748, a difference of 0.14%), and Czechoslovakian ($60,581, a difference of 0.14%).
| Demographics | Rating | Rank | Householder Income Over 65 years |
| Immigrants | Poland | 51.9 /100 | #172 | Average $61,041 |
| Immigrants | Micronesia | 50.8 /100 | #173 | Average $61,000 |
| Luxembourgers | 50.0 /100 | #174 | Average $60,967 |
| Spaniards | 47.3 /100 | #175 | Average $60,866 |
| Spanish | 45.5 /100 | #176 | Average $60,795 |
| Alaska Natives | 44.3 /100 | #177 | Average $60,748 |
| Yup'ik | 43.7 /100 | #178 | Average $60,727 |
| Welsh | 42.2 /100 | #179 | Average $60,666 |
| Immigrants | Morocco | 41.7 /100 | #180 | Average $60,647 |
| Celtics | 40.7 /100 | #181 | Average $60,608 |
| Czechoslovakians | 40.0 /100 | #182 | Average $60,581 |
| Kenyans | 38.4 /100 | #183 | Fair $60,514 |
| Iraqis | 37.2 /100 | #184 | Fair $60,466 |
| Albanians | 32.0 /100 | #185 | Fair $60,249 |
| Slovenes | 31.8 /100 | #186 | Fair $60,241 |