Immigrants from Romania vs Immigrants from Ghana Householder Income Over 65 years
COMPARE
Immigrants from Romania
Immigrants from Ghana
Householder Income Over 65 years
Householder Income Over 65 years Comparison
Immigrants from Romania
Immigrants from Ghana
$64,462
HOUSEHOLDER INCOME OVER 65 YEARS
97.5/ 100
METRIC RATING
88th/ 347
METRIC RANK
$58,624
HOUSEHOLDER INCOME OVER 65 YEARS
7.9/ 100
METRIC RATING
215th/ 347
METRIC RANK
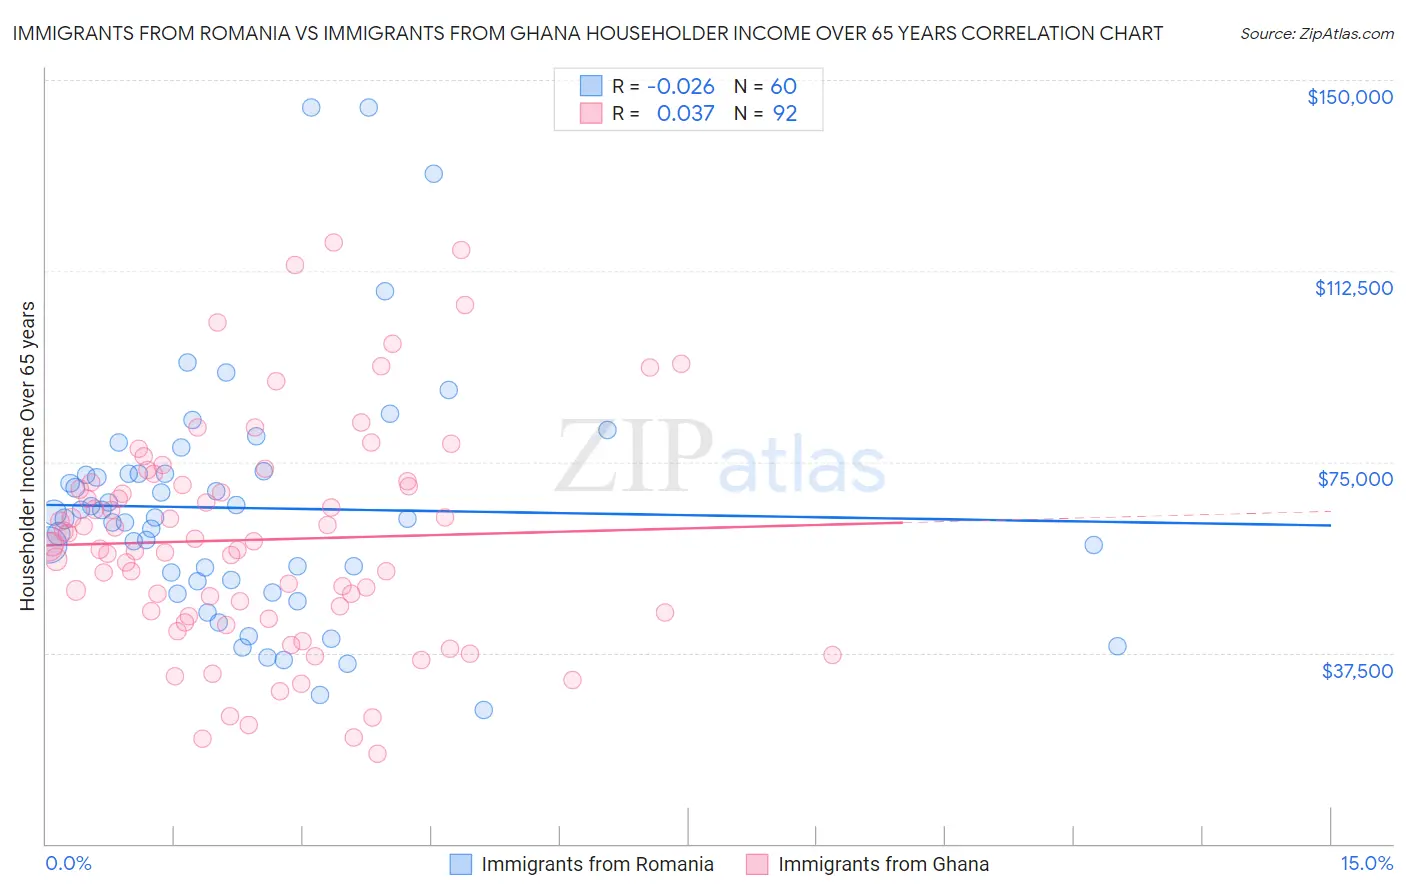
Immigrants from Romania vs Immigrants from Ghana Householder Income Over 65 years Correlation Chart
The statistical analysis conducted on geographies consisting of 256,630,190 people shows no correlation between the proportion of Immigrants from Romania and household income with householder over the age of 65 in the United States with a correlation coefficient (R) of -0.026 and weighted average of $64,462. Similarly, the statistical analysis conducted on geographies consisting of 199,306,105 people shows no correlation between the proportion of Immigrants from Ghana and household income with householder over the age of 65 in the United States with a correlation coefficient (R) of 0.037 and weighted average of $58,624, a difference of 10.0%.
Householder Income Over 65 years Correlation Summary
| Measurement | Immigrants from Romania | Immigrants from Ghana |
| Minimum | $26,354 | $17,788 |
| Maximum | $144,651 | $118,015 |
| Range | $118,297 | $100,227 |
| Mean | $65,931 | $59,709 |
| Median | $63,917 | $58,613 |
| Interquartile 25% (IQ1) | $51,757 | $45,151 |
| Interquartile 75% (IQ3) | $72,732 | $70,697 |
| Interquartile Range (IQR) | $20,976 | $25,546 |
| Standard Deviation (Sample) | $23,898 | $21,702 |
| Standard Deviation (Population) | $23,698 | $21,584 |
Similar Demographics by Householder Income Over 65 years
Demographics Similar to Immigrants from Romania by Householder Income Over 65 years
In terms of householder income over 65 years, the demographic groups most similar to Immigrants from Romania are Austrian ($64,470, a difference of 0.010%), Paraguayan ($64,443, a difference of 0.030%), Immigrants from Kuwait ($64,433, a difference of 0.040%), Immigrants from Oceania ($64,416, a difference of 0.070%), and Immigrants from Russia ($64,512, a difference of 0.080%).
| Demographics | Rating | Rank | Householder Income Over 65 years |
| Immigrants | Europe | 98.3 /100 | #81 | Exceptional $64,828 |
| Immigrants | Fiji | 98.2 /100 | #82 | Exceptional $64,795 |
| Northern Europeans | 97.9 /100 | #83 | Exceptional $64,658 |
| Immigrants | Greece | 97.9 /100 | #84 | Exceptional $64,636 |
| Immigrants | Lebanon | 97.6 /100 | #85 | Exceptional $64,521 |
| Immigrants | Russia | 97.6 /100 | #86 | Exceptional $64,512 |
| Austrians | 97.5 /100 | #87 | Exceptional $64,470 |
| Immigrants | Romania | 97.5 /100 | #88 | Exceptional $64,462 |
| Paraguayans | 97.4 /100 | #89 | Exceptional $64,443 |
| Immigrants | Kuwait | 97.4 /100 | #90 | Exceptional $64,433 |
| Immigrants | Oceania | 97.4 /100 | #91 | Exceptional $64,416 |
| Immigrants | Bulgaria | 97.3 /100 | #92 | Exceptional $64,379 |
| Jordanians | 97.1 /100 | #93 | Exceptional $64,313 |
| Immigrants | Egypt | 97.0 /100 | #94 | Exceptional $64,299 |
| Immigrants | Latvia | 97.0 /100 | #95 | Exceptional $64,298 |
Demographics Similar to Immigrants from Ghana by Householder Income Over 65 years
In terms of householder income over 65 years, the demographic groups most similar to Immigrants from Ghana are Nepalese ($58,761, a difference of 0.23%), White/Caucasian ($58,847, a difference of 0.38%), Colombian ($58,851, a difference of 0.39%), Immigrants from Middle Africa ($58,375, a difference of 0.43%), and Immigrants from Nigeria ($58,942, a difference of 0.54%).
| Demographics | Rating | Rank | Householder Income Over 65 years |
| Uruguayans | 12.3 /100 | #208 | Poor $59,090 |
| Slovaks | 11.7 /100 | #209 | Poor $59,039 |
| Nigerians | 11.2 /100 | #210 | Poor $58,992 |
| Immigrants | Nigeria | 10.7 /100 | #211 | Poor $58,942 |
| Colombians | 9.8 /100 | #212 | Tragic $58,851 |
| Whites/Caucasians | 9.8 /100 | #213 | Tragic $58,847 |
| Nepalese | 9.0 /100 | #214 | Tragic $58,761 |
| Immigrants | Ghana | 7.9 /100 | #215 | Tragic $58,624 |
| Immigrants | Middle Africa | 6.2 /100 | #216 | Tragic $58,375 |
| Sudanese | 5.7 /100 | #217 | Tragic $58,281 |
| Panamanians | 5.6 /100 | #218 | Tragic $58,266 |
| Malaysians | 5.5 /100 | #219 | Tragic $58,244 |
| Yugoslavians | 5.5 /100 | #220 | Tragic $58,243 |
| Immigrants | El Salvador | 5.4 /100 | #221 | Tragic $58,226 |
| Delaware | 5.3 /100 | #222 | Tragic $58,214 |