Immigrants from Romania vs Bhutanese 7th Grade
COMPARE
Immigrants from Romania
Bhutanese
7th Grade
7th Grade Comparison
Immigrants from Romania
Bhutanese
96.4%
7TH GRADE
93.2/ 100
METRIC RATING
128th/ 347
METRIC RANK
96.6%
7TH GRADE
97.7/ 100
METRIC RATING
109th/ 347
METRIC RANK
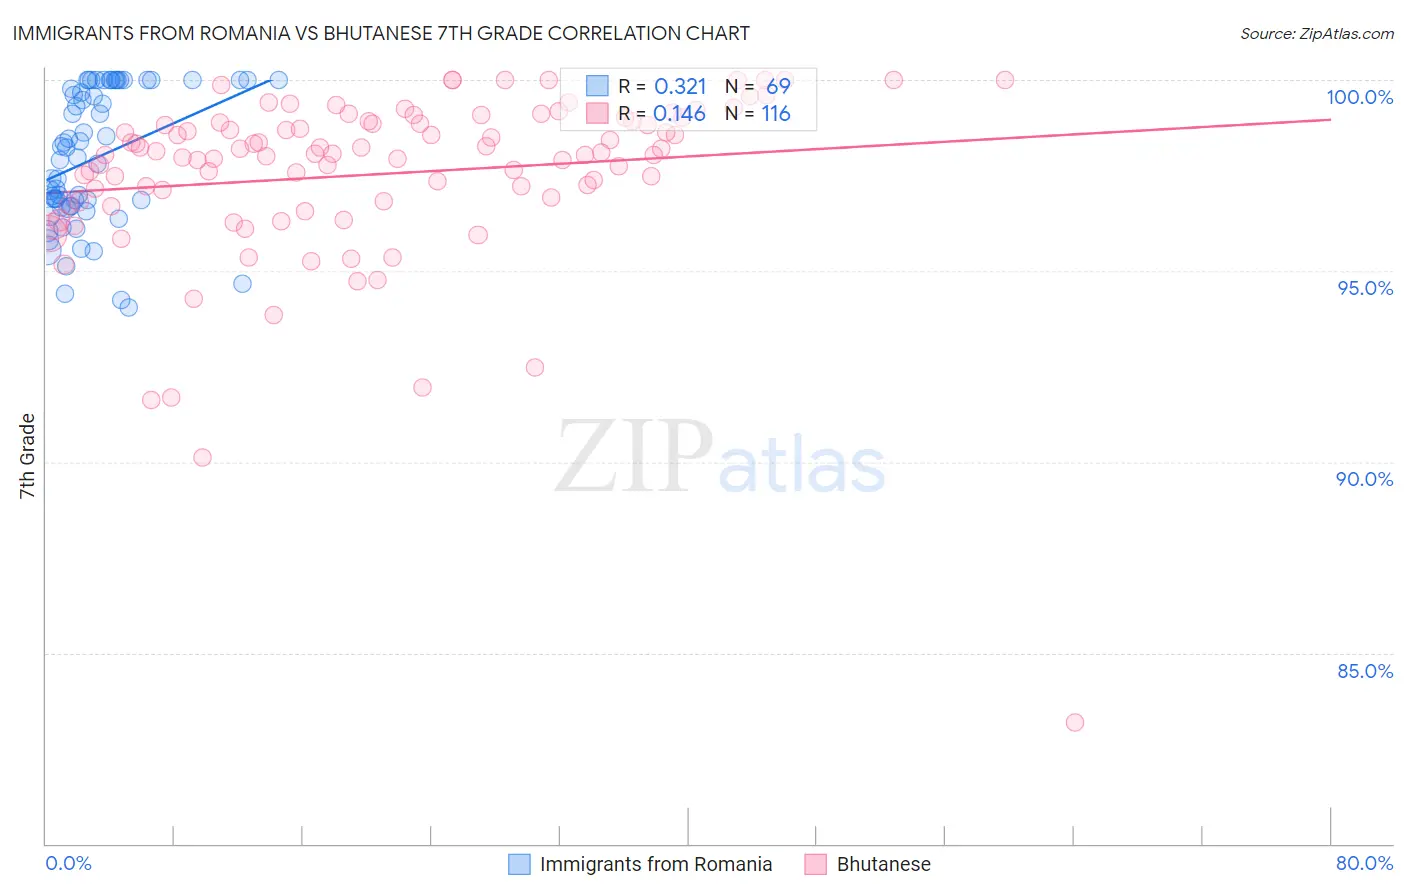
Immigrants from Romania vs Bhutanese 7th Grade Correlation Chart
The statistical analysis conducted on geographies consisting of 257,008,799 people shows a mild positive correlation between the proportion of Immigrants from Romania and percentage of population with at least 7th grade education in the United States with a correlation coefficient (R) of 0.321 and weighted average of 96.4%. Similarly, the statistical analysis conducted on geographies consisting of 455,591,134 people shows a poor positive correlation between the proportion of Bhutanese and percentage of population with at least 7th grade education in the United States with a correlation coefficient (R) of 0.146 and weighted average of 96.6%, a difference of 0.17%.
7th Grade Correlation Summary
| Measurement | Immigrants from Romania | Bhutanese |
| Minimum | 94.0% | 83.2% |
| Maximum | 100.0% | 100.0% |
| Range | 6.0% | 16.8% |
| Mean | 97.9% | 97.5% |
| Median | 98.0% | 98.1% |
| Interquartile 25% (IQ1) | 96.7% | 96.8% |
| Interquartile 75% (IQ3) | 100.0% | 98.9% |
| Interquartile Range (IQR) | 3.3% | 2.1% |
| Standard Deviation (Sample) | 1.8% | 2.3% |
| Standard Deviation (Population) | 1.8% | 2.3% |
Demographics Similar to Immigrants from Romania and Bhutanese by 7th Grade
In terms of 7th grade, the demographic groups most similar to Immigrants from Romania are Immigrants from Bosnia and Herzegovina (96.4%, a difference of 0.0%), Palestinian (96.4%, a difference of 0.010%), Immigrants from Bulgaria (96.4%, a difference of 0.020%), Immigrants from Switzerland (96.5%, a difference of 0.030%), and Immigrants from Europe (96.5%, a difference of 0.040%). Similarly, the demographic groups most similar to Bhutanese are Immigrants from Saudi Arabia (96.6%, a difference of 0.010%), Okinawan (96.6%, a difference of 0.020%), Immigrants from Latvia (96.6%, a difference of 0.020%), Nonimmigrants (96.5%, a difference of 0.040%), and Pueblo (96.5%, a difference of 0.050%).
| Demographics | Rating | Rank | 7th Grade |
| Immigrants | Saudi Arabia | 97.8 /100 | #108 | Exceptional 96.6% |
| Bhutanese | 97.7 /100 | #109 | Exceptional 96.6% |
| Okinawans | 97.4 /100 | #110 | Exceptional 96.6% |
| Immigrants | Latvia | 97.4 /100 | #111 | Exceptional 96.6% |
| Immigrants | Nonimmigrants | 97.0 /100 | #112 | Exceptional 96.5% |
| Pueblo | 96.8 /100 | #113 | Exceptional 96.5% |
| Immigrants | Zimbabwe | 96.6 /100 | #114 | Exceptional 96.5% |
| Choctaw | 96.6 /100 | #115 | Exceptional 96.5% |
| Syrians | 96.6 /100 | #116 | Exceptional 96.5% |
| Immigrants | Moldova | 95.7 /100 | #117 | Exceptional 96.5% |
| Immigrants | Japan | 95.5 /100 | #118 | Exceptional 96.5% |
| Immigrants | Norway | 95.2 /100 | #119 | Exceptional 96.5% |
| Immigrants | Croatia | 95.0 /100 | #120 | Exceptional 96.5% |
| Cheyenne | 94.9 /100 | #121 | Exceptional 96.5% |
| Immigrants | Europe | 94.8 /100 | #122 | Exceptional 96.5% |
| Immigrants | France | 94.7 /100 | #123 | Exceptional 96.5% |
| Immigrants | Switzerland | 94.5 /100 | #124 | Exceptional 96.5% |
| Immigrants | Bulgaria | 94.0 /100 | #125 | Exceptional 96.4% |
| Palestinians | 93.5 /100 | #126 | Exceptional 96.4% |
| Immigrants | Bosnia and Herzegovina | 93.3 /100 | #127 | Exceptional 96.4% |
| Immigrants | Romania | 93.2 /100 | #128 | Exceptional 96.4% |