Immigrants from Romania vs Alsatian Householder Income Ages 45 - 64 years
COMPARE
Immigrants from Romania
Alsatian
Householder Income Ages 45 - 64 years
Householder Income Ages 45 - 64 years Comparison
Immigrants from Romania
Alsatians
$110,633
HOUSEHOLDER INCOME AGES 45 - 64 YEARS
99.4/ 100
METRIC RATING
68th/ 347
METRIC RANK
$100,435
HOUSEHOLDER INCOME AGES 45 - 64 YEARS
51.4/ 100
METRIC RATING
173rd/ 347
METRIC RANK
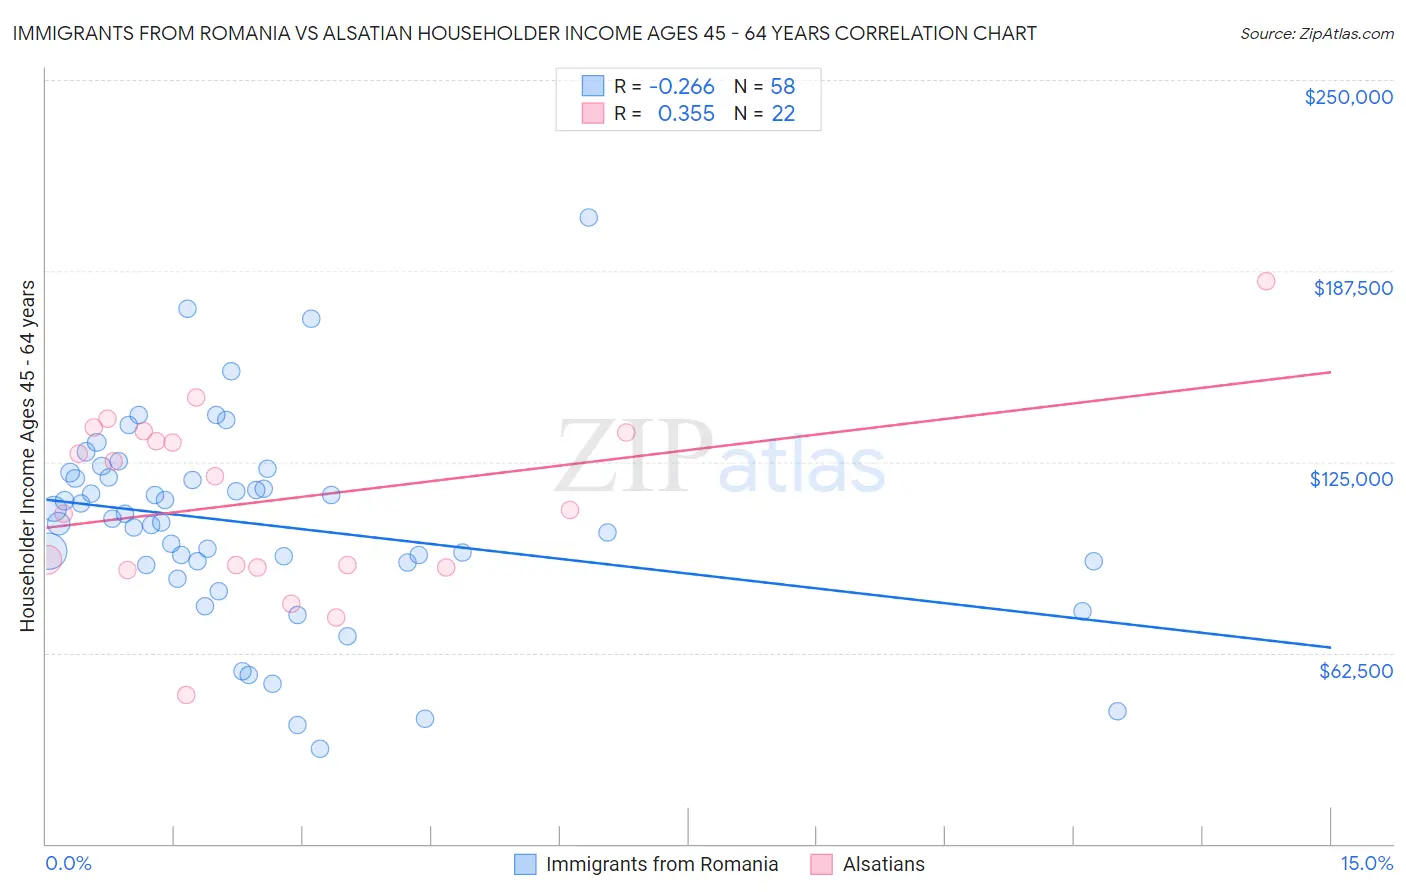
Immigrants from Romania vs Alsatian Householder Income Ages 45 - 64 years Correlation Chart
The statistical analysis conducted on geographies consisting of 256,866,242 people shows a weak negative correlation between the proportion of Immigrants from Romania and household income with householder between the ages 45 and 64 in the United States with a correlation coefficient (R) of -0.266 and weighted average of $110,633. Similarly, the statistical analysis conducted on geographies consisting of 82,661,679 people shows a mild positive correlation between the proportion of Alsatians and household income with householder between the ages 45 and 64 in the United States with a correlation coefficient (R) of 0.355 and weighted average of $100,435, a difference of 10.2%.
Householder Income Ages 45 - 64 years Correlation Summary
| Measurement | Immigrants from Romania | Alsatian |
| Minimum | $31,250 | $48,731 |
| Maximum | $205,179 | $184,018 |
| Range | $173,929 | $135,287 |
| Mean | $104,590 | $112,529 |
| Median | $105,645 | $114,674 |
| Interquartile 25% (IQ1) | $91,875 | $90,588 |
| Interquartile 75% (IQ3) | $119,992 | $134,688 |
| Interquartile Range (IQR) | $28,117 | $44,100 |
| Standard Deviation (Sample) | $32,951 | $30,232 |
| Standard Deviation (Population) | $32,666 | $29,537 |
Similar Demographics by Householder Income Ages 45 - 64 years
Demographics Similar to Immigrants from Romania by Householder Income Ages 45 - 64 years
In terms of householder income ages 45 - 64 years, the demographic groups most similar to Immigrants from Romania are Immigrants from Italy ($110,434, a difference of 0.18%), Korean ($110,334, a difference of 0.27%), Italian ($110,224, a difference of 0.37%), Laotian ($111,051, a difference of 0.38%), and Assyrian/Chaldean/Syriac ($110,201, a difference of 0.39%).
| Demographics | Rating | Rank | Householder Income Ages 45 - 64 years |
| Immigrants | Czechoslovakia | 99.7 /100 | #61 | Exceptional $111,914 |
| Immigrants | Norway | 99.7 /100 | #62 | Exceptional $111,669 |
| Mongolians | 99.6 /100 | #63 | Exceptional $111,602 |
| Immigrants | Latvia | 99.6 /100 | #64 | Exceptional $111,454 |
| Immigrants | Belarus | 99.6 /100 | #65 | Exceptional $111,430 |
| New Zealanders | 99.6 /100 | #66 | Exceptional $111,286 |
| Laotians | 99.5 /100 | #67 | Exceptional $111,051 |
| Immigrants | Romania | 99.4 /100 | #68 | Exceptional $110,633 |
| Immigrants | Italy | 99.4 /100 | #69 | Exceptional $110,434 |
| Koreans | 99.3 /100 | #70 | Exceptional $110,334 |
| Italians | 99.3 /100 | #71 | Exceptional $110,224 |
| Assyrians/Chaldeans/Syriacs | 99.3 /100 | #72 | Exceptional $110,201 |
| Argentineans | 99.3 /100 | #73 | Exceptional $110,103 |
| Immigrants | Egypt | 99.2 /100 | #74 | Exceptional $109,941 |
| South Africans | 99.1 /100 | #75 | Exceptional $109,719 |
Demographics Similar to Alsatians by Householder Income Ages 45 - 64 years
In terms of householder income ages 45 - 64 years, the demographic groups most similar to Alsatians are Immigrants from Uzbekistan ($100,523, a difference of 0.090%), Welsh ($100,322, a difference of 0.11%), German ($100,224, a difference of 0.21%), Immigrants from Costa Rica ($100,141, a difference of 0.29%), and Moroccan ($100,138, a difference of 0.30%).
| Demographics | Rating | Rank | Householder Income Ages 45 - 64 years |
| Samoans | 65.3 /100 | #166 | Good $101,580 |
| Czechoslovakians | 63.0 /100 | #167 | Good $101,387 |
| South American Indians | 60.5 /100 | #168 | Good $101,171 |
| Guamanians/Chamorros | 60.5 /100 | #169 | Good $101,170 |
| Slovaks | 58.8 /100 | #170 | Average $101,029 |
| South Americans | 56.4 /100 | #171 | Average $100,837 |
| Immigrants | Uzbekistan | 52.5 /100 | #172 | Average $100,523 |
| Alsatians | 51.4 /100 | #173 | Average $100,435 |
| Welsh | 50.0 /100 | #174 | Average $100,322 |
| Germans | 48.8 /100 | #175 | Average $100,224 |
| Immigrants | Costa Rica | 47.7 /100 | #176 | Average $100,141 |
| Moroccans | 47.7 /100 | #177 | Average $100,138 |
| Immigrants | Cameroon | 47.0 /100 | #178 | Average $100,084 |
| Belgians | 46.7 /100 | #179 | Average $100,060 |
| Aleuts | 46.6 /100 | #180 | Average $100,052 |