Immigrants from Romania vs Lithuanian Householder Income Ages 45 - 64 years
COMPARE
Immigrants from Romania
Lithuanian
Householder Income Ages 45 - 64 years
Householder Income Ages 45 - 64 years Comparison
Immigrants from Romania
Lithuanians
$110,633
HOUSEHOLDER INCOME AGES 45 - 64 YEARS
99.4/ 100
METRIC RATING
68th/ 347
METRIC RANK
$112,484
HOUSEHOLDER INCOME AGES 45 - 64 YEARS
99.8/ 100
METRIC RATING
55th/ 347
METRIC RANK
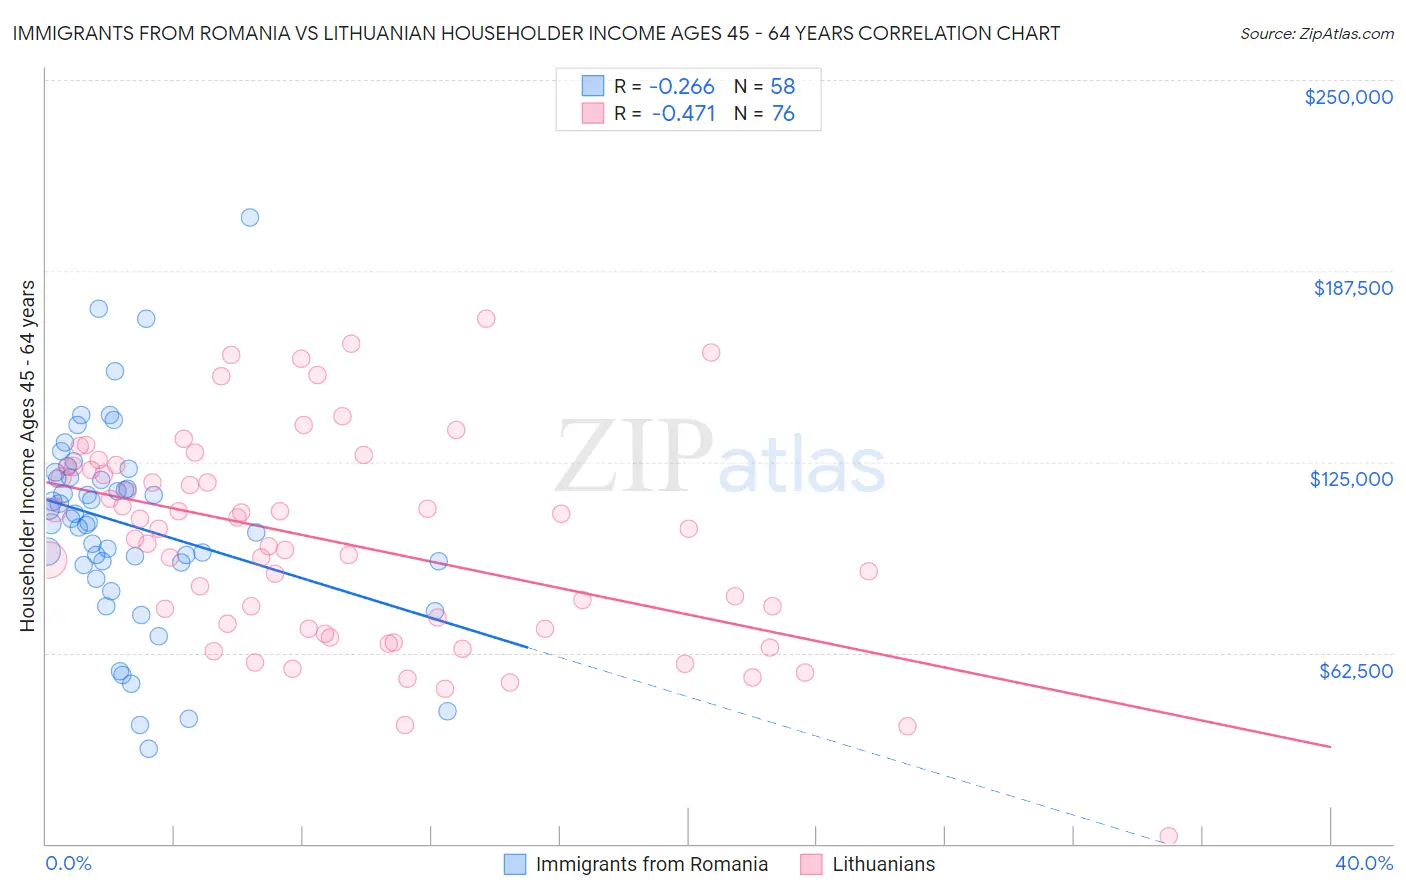
Immigrants from Romania vs Lithuanian Householder Income Ages 45 - 64 years Correlation Chart
The statistical analysis conducted on geographies consisting of 256,866,242 people shows a weak negative correlation between the proportion of Immigrants from Romania and household income with householder between the ages 45 and 64 in the United States with a correlation coefficient (R) of -0.266 and weighted average of $110,633. Similarly, the statistical analysis conducted on geographies consisting of 421,155,737 people shows a moderate negative correlation between the proportion of Lithuanians and household income with householder between the ages 45 and 64 in the United States with a correlation coefficient (R) of -0.471 and weighted average of $112,484, a difference of 1.7%.
Householder Income Ages 45 - 64 years Correlation Summary
| Measurement | Immigrants from Romania | Lithuanian |
| Minimum | $31,250 | $2,499 |
| Maximum | $205,179 | $171,736 |
| Range | $173,929 | $169,237 |
| Mean | $104,590 | $98,659 |
| Median | $105,645 | $101,418 |
| Interquartile 25% (IQ1) | $91,875 | $70,474 |
| Interquartile 75% (IQ3) | $119,992 | $122,894 |
| Interquartile Range (IQR) | $28,117 | $52,420 |
| Standard Deviation (Sample) | $32,951 | $34,121 |
| Standard Deviation (Population) | $32,666 | $33,896 |
Demographics Similar to Immigrants from Romania and Lithuanians by Householder Income Ages 45 - 64 years
In terms of householder income ages 45 - 64 years, the demographic groups most similar to Immigrants from Romania are Immigrants from Italy ($110,434, a difference of 0.18%), Korean ($110,334, a difference of 0.27%), Italian ($110,224, a difference of 0.37%), Laotian ($111,051, a difference of 0.38%), and New Zealander ($111,286, a difference of 0.59%). Similarly, the demographic groups most similar to Lithuanians are Greek ($112,630, a difference of 0.13%), Afghan ($112,676, a difference of 0.17%), Egyptian ($112,256, a difference of 0.20%), Immigrants from Malaysia ($112,796, a difference of 0.28%), and Immigrants from Scotland ($112,175, a difference of 0.28%).
| Demographics | Rating | Rank | Householder Income Ages 45 - 64 years |
| Immigrants | South Africa | 99.8 /100 | #51 | Exceptional $112,886 |
| Immigrants | Malaysia | 99.8 /100 | #52 | Exceptional $112,796 |
| Afghans | 99.8 /100 | #53 | Exceptional $112,676 |
| Greeks | 99.8 /100 | #54 | Exceptional $112,630 |
| Lithuanians | 99.8 /100 | #55 | Exceptional $112,484 |
| Egyptians | 99.7 /100 | #56 | Exceptional $112,256 |
| Immigrants | Scotland | 99.7 /100 | #57 | Exceptional $112,175 |
| Soviet Union | 99.7 /100 | #58 | Exceptional $112,008 |
| Immigrants | Europe | 99.7 /100 | #59 | Exceptional $111,984 |
| Immigrants | Netherlands | 99.7 /100 | #60 | Exceptional $111,982 |
| Immigrants | Czechoslovakia | 99.7 /100 | #61 | Exceptional $111,914 |
| Immigrants | Norway | 99.7 /100 | #62 | Exceptional $111,669 |
| Mongolians | 99.6 /100 | #63 | Exceptional $111,602 |
| Immigrants | Latvia | 99.6 /100 | #64 | Exceptional $111,454 |
| Immigrants | Belarus | 99.6 /100 | #65 | Exceptional $111,430 |
| New Zealanders | 99.6 /100 | #66 | Exceptional $111,286 |
| Laotians | 99.5 /100 | #67 | Exceptional $111,051 |
| Immigrants | Romania | 99.4 /100 | #68 | Exceptional $110,633 |
| Immigrants | Italy | 99.4 /100 | #69 | Exceptional $110,434 |
| Koreans | 99.3 /100 | #70 | Exceptional $110,334 |
| Italians | 99.3 /100 | #71 | Exceptional $110,224 |