Immigrants from Fiji vs Alsatian Householder Income Ages 45 - 64 years
COMPARE
Immigrants from Fiji
Alsatian
Householder Income Ages 45 - 64 years
Householder Income Ages 45 - 64 years Comparison
Immigrants from Fiji
Alsatians
$106,952
HOUSEHOLDER INCOME AGES 45 - 64 YEARS
96.5/ 100
METRIC RATING
107th/ 347
METRIC RANK
$100,435
HOUSEHOLDER INCOME AGES 45 - 64 YEARS
51.4/ 100
METRIC RATING
173rd/ 347
METRIC RANK
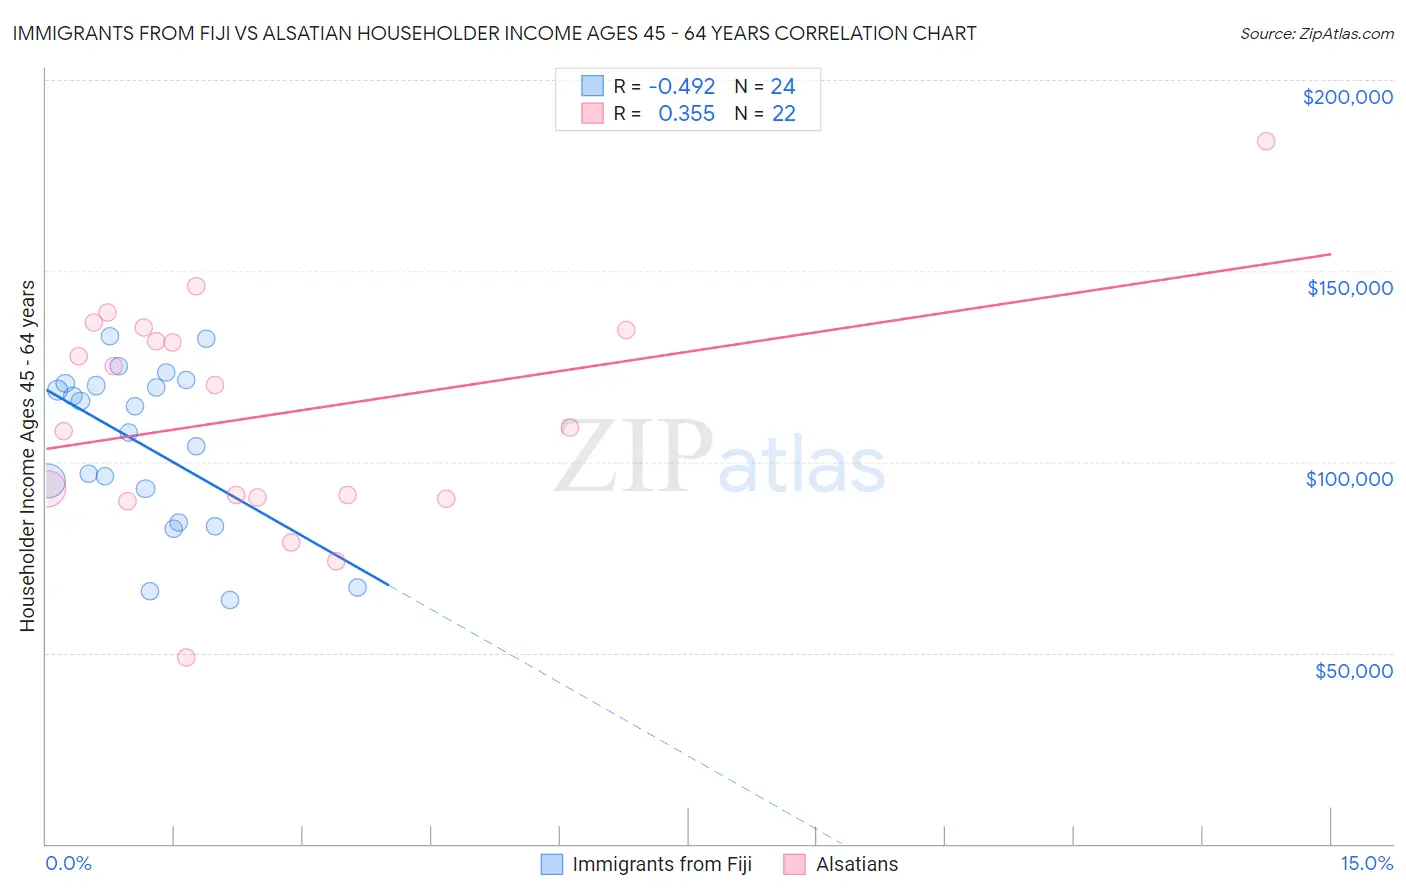
Immigrants from Fiji vs Alsatian Householder Income Ages 45 - 64 years Correlation Chart
The statistical analysis conducted on geographies consisting of 93,744,178 people shows a moderate negative correlation between the proportion of Immigrants from Fiji and household income with householder between the ages 45 and 64 in the United States with a correlation coefficient (R) of -0.492 and weighted average of $106,952. Similarly, the statistical analysis conducted on geographies consisting of 82,661,679 people shows a mild positive correlation between the proportion of Alsatians and household income with householder between the ages 45 and 64 in the United States with a correlation coefficient (R) of 0.355 and weighted average of $100,435, a difference of 6.5%.
Householder Income Ages 45 - 64 years Correlation Summary
| Measurement | Immigrants from Fiji | Alsatian |
| Minimum | $63,895 | $48,731 |
| Maximum | $132,819 | $184,018 |
| Range | $68,924 | $135,287 |
| Mean | $104,214 | $112,529 |
| Median | $111,173 | $114,674 |
| Interquartile 25% (IQ1) | $88,582 | $90,588 |
| Interquartile 75% (IQ3) | $120,299 | $134,688 |
| Interquartile Range (IQR) | $31,717 | $44,100 |
| Standard Deviation (Sample) | $21,039 | $30,232 |
| Standard Deviation (Population) | $20,596 | $29,537 |
Similar Demographics by Householder Income Ages 45 - 64 years
Demographics Similar to Immigrants from Fiji by Householder Income Ages 45 - 64 years
In terms of householder income ages 45 - 64 years, the demographic groups most similar to Immigrants from Fiji are Armenian ($107,002, a difference of 0.050%), Zimbabwean ($106,849, a difference of 0.10%), Macedonian ($107,074, a difference of 0.11%), Immigrants from Ukraine ($107,079, a difference of 0.12%), and Syrian ($107,207, a difference of 0.24%).
| Demographics | Rating | Rank | Householder Income Ages 45 - 64 years |
| Immigrants | Serbia | 97.4 /100 | #100 | Exceptional $107,569 |
| Immigrants | Kazakhstan | 97.2 /100 | #101 | Exceptional $107,378 |
| Immigrants | Moldova | 97.1 /100 | #102 | Exceptional $107,357 |
| Syrians | 96.9 /100 | #103 | Exceptional $107,207 |
| Immigrants | Ukraine | 96.7 /100 | #104 | Exceptional $107,079 |
| Macedonians | 96.7 /100 | #105 | Exceptional $107,074 |
| Armenians | 96.6 /100 | #106 | Exceptional $107,002 |
| Immigrants | Fiji | 96.5 /100 | #107 | Exceptional $106,952 |
| Zimbabweans | 96.3 /100 | #108 | Exceptional $106,849 |
| Chileans | 95.9 /100 | #109 | Exceptional $106,611 |
| Immigrants | Brazil | 95.6 /100 | #110 | Exceptional $106,470 |
| Immigrants | Vietnam | 95.5 /100 | #111 | Exceptional $106,417 |
| Swedes | 95.4 /100 | #112 | Exceptional $106,377 |
| Europeans | 95.4 /100 | #113 | Exceptional $106,367 |
| Immigrants | Poland | 95.3 /100 | #114 | Exceptional $106,319 |
Demographics Similar to Alsatians by Householder Income Ages 45 - 64 years
In terms of householder income ages 45 - 64 years, the demographic groups most similar to Alsatians are Immigrants from Uzbekistan ($100,523, a difference of 0.090%), Welsh ($100,322, a difference of 0.11%), German ($100,224, a difference of 0.21%), Immigrants from Costa Rica ($100,141, a difference of 0.29%), and Moroccan ($100,138, a difference of 0.30%).
| Demographics | Rating | Rank | Householder Income Ages 45 - 64 years |
| Samoans | 65.3 /100 | #166 | Good $101,580 |
| Czechoslovakians | 63.0 /100 | #167 | Good $101,387 |
| South American Indians | 60.5 /100 | #168 | Good $101,171 |
| Guamanians/Chamorros | 60.5 /100 | #169 | Good $101,170 |
| Slovaks | 58.8 /100 | #170 | Average $101,029 |
| South Americans | 56.4 /100 | #171 | Average $100,837 |
| Immigrants | Uzbekistan | 52.5 /100 | #172 | Average $100,523 |
| Alsatians | 51.4 /100 | #173 | Average $100,435 |
| Welsh | 50.0 /100 | #174 | Average $100,322 |
| Germans | 48.8 /100 | #175 | Average $100,224 |
| Immigrants | Costa Rica | 47.7 /100 | #176 | Average $100,141 |
| Moroccans | 47.7 /100 | #177 | Average $100,138 |
| Immigrants | Cameroon | 47.0 /100 | #178 | Average $100,084 |
| Belgians | 46.7 /100 | #179 | Average $100,060 |
| Aleuts | 46.6 /100 | #180 | Average $100,052 |