Immigrants from Poland vs Native Hawaiian In Labor Force | Age 35-44
COMPARE
Immigrants from Poland
Native Hawaiian
In Labor Force | Age 35-44
In Labor Force | Age 35-44 Comparison
Immigrants from Poland
Native Hawaiians
85.2%
IN LABOR FORCE | AGE 35-44
99.8/ 100
METRIC RATING
38th/ 347
METRIC RANK
83.9%
IN LABOR FORCE | AGE 35-44
3.0/ 100
METRIC RATING
232nd/ 347
METRIC RANK
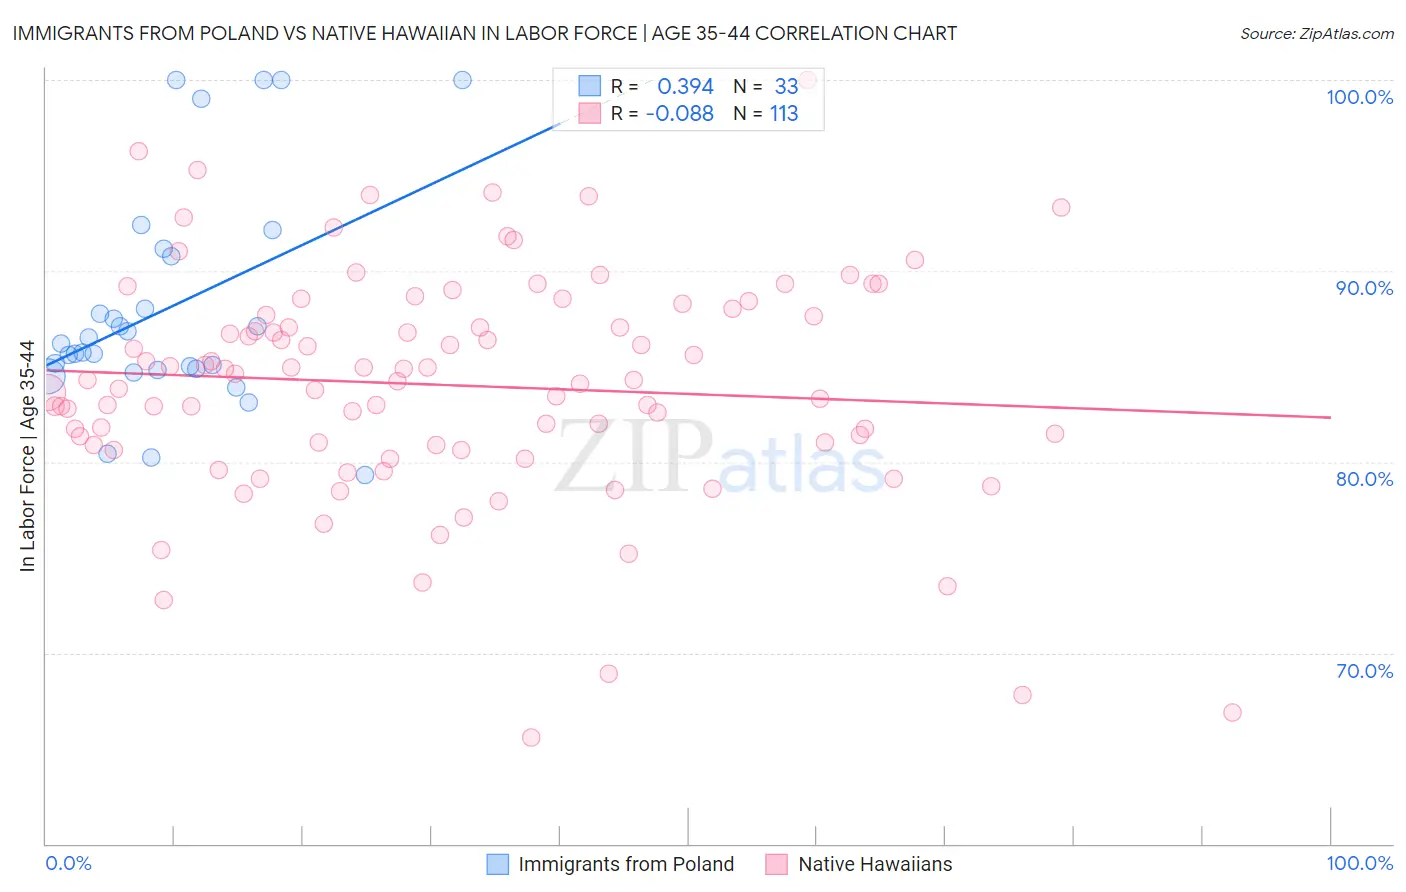
Immigrants from Poland vs Native Hawaiian In Labor Force | Age 35-44 Correlation Chart
The statistical analysis conducted on geographies consisting of 304,792,655 people shows a mild positive correlation between the proportion of Immigrants from Poland and labor force participation rate among population between the ages 35 and 44 in the United States with a correlation coefficient (R) of 0.394 and weighted average of 85.2%. Similarly, the statistical analysis conducted on geographies consisting of 331,970,144 people shows a slight negative correlation between the proportion of Native Hawaiians and labor force participation rate among population between the ages 35 and 44 in the United States with a correlation coefficient (R) of -0.088 and weighted average of 83.9%, a difference of 1.6%.
In Labor Force | Age 35-44 Correlation Summary
| Measurement | Immigrants from Poland | Native Hawaiian |
| Minimum | 79.3% | 65.6% |
| Maximum | 100.0% | 100.0% |
| Range | 20.7% | 34.4% |
| Mean | 88.1% | 84.0% |
| Median | 86.2% | 84.3% |
| Interquartile 25% (IQ1) | 84.9% | 80.9% |
| Interquartile 75% (IQ3) | 90.9% | 87.8% |
| Interquartile Range (IQR) | 6.1% | 7.0% |
| Standard Deviation (Sample) | 5.8% | 6.0% |
| Standard Deviation (Population) | 5.7% | 6.0% |
Similar Demographics by In Labor Force | Age 35-44
Demographics Similar to Immigrants from Poland by In Labor Force | Age 35-44
In terms of in labor force | age 35-44, the demographic groups most similar to Immigrants from Poland are Eastern European (85.2%, a difference of 0.0%), Kenyan (85.2%, a difference of 0.010%), Immigrants from Bulgaria (85.2%, a difference of 0.010%), Immigrants from Zimbabwe (85.2%, a difference of 0.010%), and Macedonian (85.2%, a difference of 0.010%).
| Demographics | Rating | Rank | In Labor Force | Age 35-44 |
| Czechs | 99.9 /100 | #31 | Exceptional 85.3% |
| Immigrants | India | 99.9 /100 | #32 | Exceptional 85.3% |
| Ugandans | 99.9 /100 | #33 | Exceptional 85.3% |
| Immigrants | Nepal | 99.9 /100 | #34 | Exceptional 85.3% |
| Estonians | 99.9 /100 | #35 | Exceptional 85.3% |
| Immigrants | Morocco | 99.8 /100 | #36 | Exceptional 85.2% |
| Kenyans | 99.8 /100 | #37 | Exceptional 85.2% |
| Immigrants | Poland | 99.8 /100 | #38 | Exceptional 85.2% |
| Eastern Europeans | 99.8 /100 | #39 | Exceptional 85.2% |
| Immigrants | Bulgaria | 99.8 /100 | #40 | Exceptional 85.2% |
| Immigrants | Zimbabwe | 99.8 /100 | #41 | Exceptional 85.2% |
| Macedonians | 99.8 /100 | #42 | Exceptional 85.2% |
| Poles | 99.8 /100 | #43 | Exceptional 85.2% |
| Lithuanians | 99.8 /100 | #44 | Exceptional 85.2% |
| Cypriots | 99.8 /100 | #45 | Exceptional 85.2% |
Demographics Similar to Native Hawaiians by In Labor Force | Age 35-44
In terms of in labor force | age 35-44, the demographic groups most similar to Native Hawaiians are Scottish (83.9%, a difference of 0.010%), Immigrants from Germany (83.9%, a difference of 0.010%), Immigrants from Oceania (83.9%, a difference of 0.020%), Immigrants from Syria (83.9%, a difference of 0.030%), and Immigrants from Iraq (83.9%, a difference of 0.040%).
| Demographics | Rating | Rank | In Labor Force | Age 35-44 |
| Immigrants | Burma/Myanmar | 6.1 /100 | #225 | Tragic 84.0% |
| Panamanians | 5.4 /100 | #226 | Tragic 84.0% |
| British West Indians | 5.3 /100 | #227 | Tragic 84.0% |
| Welsh | 5.3 /100 | #228 | Tragic 84.0% |
| Immigrants | Thailand | 4.7 /100 | #229 | Tragic 84.0% |
| Immigrants | Iraq | 3.7 /100 | #230 | Tragic 83.9% |
| Scottish | 3.2 /100 | #231 | Tragic 83.9% |
| Native Hawaiians | 3.0 /100 | #232 | Tragic 83.9% |
| Immigrants | Germany | 2.8 /100 | #233 | Tragic 83.9% |
| Immigrants | Oceania | 2.6 /100 | #234 | Tragic 83.9% |
| Immigrants | Syria | 2.5 /100 | #235 | Tragic 83.9% |
| West Indians | 2.4 /100 | #236 | Tragic 83.9% |
| English | 1.8 /100 | #237 | Tragic 83.8% |
| Immigrants | Laos | 1.7 /100 | #238 | Tragic 83.8% |
| Celtics | 1.4 /100 | #239 | Tragic 83.8% |