Immigrants from Poland vs Spanish Median Family Income
COMPARE
Immigrants from Poland
Spanish
Median Family Income
Median Family Income Comparison
Immigrants from Poland
Spanish
$108,570
MEDIAN FAMILY INCOME
95.3/ 100
METRIC RATING
112th/ 347
METRIC RANK
$99,977
MEDIAN FAMILY INCOME
20.1/ 100
METRIC RATING
200th/ 347
METRIC RANK
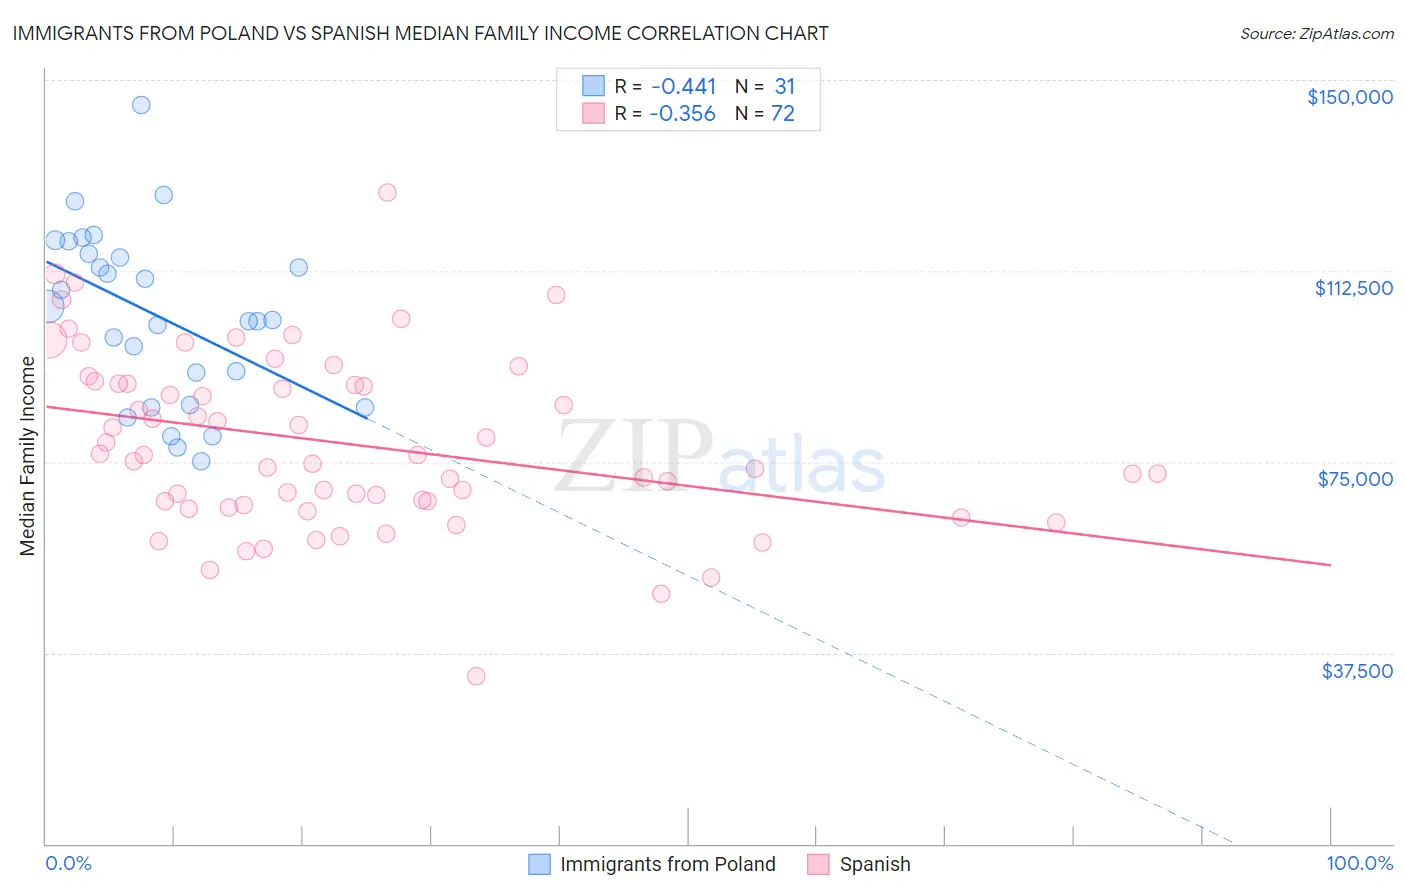
Immigrants from Poland vs Spanish Median Family Income Correlation Chart
The statistical analysis conducted on geographies consisting of 304,741,932 people shows a moderate negative correlation between the proportion of Immigrants from Poland and median family income in the United States with a correlation coefficient (R) of -0.441 and weighted average of $108,570. Similarly, the statistical analysis conducted on geographies consisting of 421,758,667 people shows a mild negative correlation between the proportion of Spanish and median family income in the United States with a correlation coefficient (R) of -0.356 and weighted average of $99,977, a difference of 8.6%.
Median Family Income Correlation Summary
| Measurement | Immigrants from Poland | Spanish |
| Minimum | $75,129 | $32,992 |
| Maximum | $144,968 | $127,945 |
| Range | $69,839 | $94,953 |
| Mean | $103,726 | $78,597 |
| Median | $102,831 | $75,704 |
| Interquartile 25% (IQ1) | $86,137 | $66,829 |
| Interquartile 75% (IQ3) | $115,861 | $90,296 |
| Interquartile Range (IQR) | $29,724 | $23,466 |
| Standard Deviation (Sample) | $16,903 | $17,174 |
| Standard Deviation (Population) | $16,628 | $17,054 |
Similar Demographics by Median Family Income
Demographics Similar to Immigrants from Poland by Median Family Income
In terms of median family income, the demographic groups most similar to Immigrants from Poland are Immigrants from Saudi Arabia ($108,544, a difference of 0.020%), Polish ($108,507, a difference of 0.060%), Swedish ($108,499, a difference of 0.070%), Immigrants from Western Asia ($108,691, a difference of 0.11%), and British ($108,705, a difference of 0.12%).
| Demographics | Rating | Rank | Median Family Income |
| Syrians | 96.7 /100 | #105 | Exceptional $109,299 |
| Albanians | 96.4 /100 | #106 | Exceptional $109,136 |
| Immigrants | North Macedonia | 96.4 /100 | #107 | Exceptional $109,136 |
| Immigrants | Zimbabwe | 95.9 /100 | #108 | Exceptional $108,830 |
| Immigrants | Afghanistan | 95.6 /100 | #109 | Exceptional $108,709 |
| British | 95.6 /100 | #110 | Exceptional $108,705 |
| Immigrants | Western Asia | 95.6 /100 | #111 | Exceptional $108,691 |
| Immigrants | Poland | 95.3 /100 | #112 | Exceptional $108,570 |
| Immigrants | Saudi Arabia | 95.2 /100 | #113 | Exceptional $108,544 |
| Poles | 95.2 /100 | #114 | Exceptional $108,507 |
| Swedes | 95.1 /100 | #115 | Exceptional $108,499 |
| Chileans | 95.0 /100 | #116 | Exceptional $108,429 |
| Immigrants | Philippines | 94.6 /100 | #117 | Exceptional $108,288 |
| Ethiopians | 94.5 /100 | #118 | Exceptional $108,251 |
| Sri Lankans | 94.5 /100 | #119 | Exceptional $108,234 |
Demographics Similar to Spanish by Median Family Income
In terms of median family income, the demographic groups most similar to Spanish are Yugoslavian ($100,119, a difference of 0.14%), Immigrants from Thailand ($99,840, a difference of 0.14%), White/Caucasian ($99,800, a difference of 0.18%), Immigrants from Africa ($100,256, a difference of 0.28%), and Immigrants from Cameroon ($100,289, a difference of 0.31%).
| Demographics | Rating | Rank | Median Family Income |
| Iraqis | 26.3 /100 | #193 | Fair $100,658 |
| Uruguayans | 26.3 /100 | #194 | Fair $100,656 |
| Immigrants | South America | 23.9 /100 | #195 | Fair $100,414 |
| Samoans | 23.3 /100 | #196 | Fair $100,344 |
| Immigrants | Cameroon | 22.8 /100 | #197 | Fair $100,289 |
| Immigrants | Africa | 22.5 /100 | #198 | Fair $100,256 |
| Yugoslavians | 21.3 /100 | #199 | Fair $100,119 |
| Spanish | 20.1 /100 | #200 | Fair $99,977 |
| Immigrants | Thailand | 19.0 /100 | #201 | Poor $99,840 |
| Whites/Caucasians | 18.7 /100 | #202 | Poor $99,800 |
| Scotch-Irish | 17.1 /100 | #203 | Poor $99,591 |
| Ghanaians | 12.6 /100 | #204 | Poor $98,877 |
| Hawaiians | 12.5 /100 | #205 | Poor $98,869 |
| Immigrants | Iraq | 12.1 /100 | #206 | Poor $98,786 |
| Aleuts | 11.6 /100 | #207 | Poor $98,702 |