Immigrants from Peru vs Immigrants from Uganda Householder Income Ages 45 - 64 years
COMPARE
Immigrants from Peru
Immigrants from Uganda
Householder Income Ages 45 - 64 years
Householder Income Ages 45 - 64 years Comparison
Immigrants from Peru
Immigrants from Uganda
$103,173
HOUSEHOLDER INCOME AGES 45 - 64 YEARS
80.7/ 100
METRIC RATING
150th/ 347
METRIC RANK
$103,584
HOUSEHOLDER INCOME AGES 45 - 64 YEARS
83.7/ 100
METRIC RATING
141st/ 347
METRIC RANK
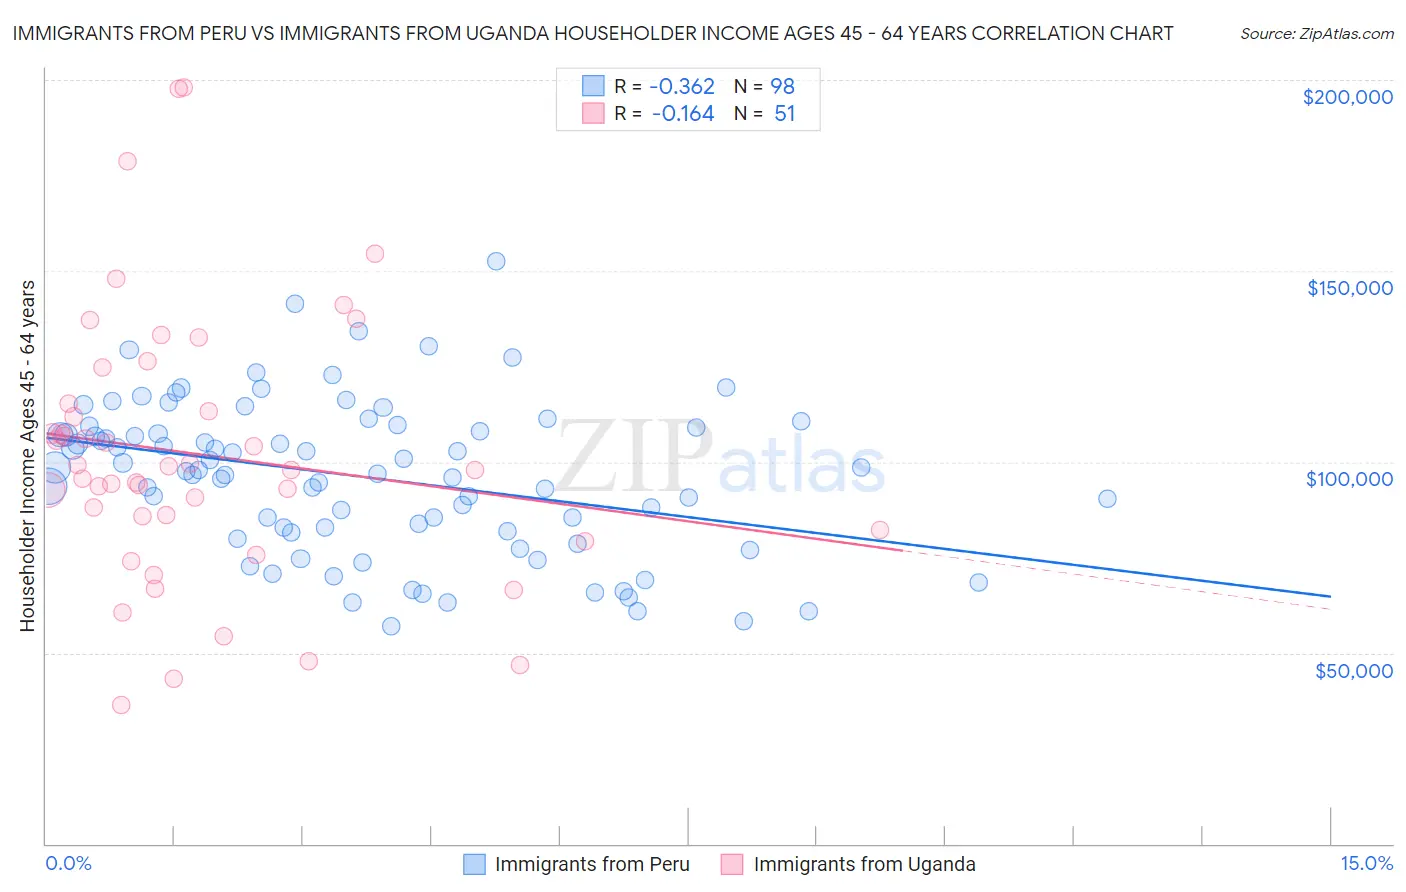
Immigrants from Peru vs Immigrants from Uganda Householder Income Ages 45 - 64 years Correlation Chart
The statistical analysis conducted on geographies consisting of 328,568,384 people shows a mild negative correlation between the proportion of Immigrants from Peru and household income with householder between the ages 45 and 64 in the United States with a correlation coefficient (R) of -0.362 and weighted average of $103,173. Similarly, the statistical analysis conducted on geographies consisting of 125,945,072 people shows a poor negative correlation between the proportion of Immigrants from Uganda and household income with householder between the ages 45 and 64 in the United States with a correlation coefficient (R) of -0.164 and weighted average of $103,584, a difference of 0.40%.
Householder Income Ages 45 - 64 years Correlation Summary
| Measurement | Immigrants from Peru | Immigrants from Uganda |
| Minimum | $56,875 | $36,234 |
| Maximum | $152,612 | $198,089 |
| Range | $95,737 | $161,856 |
| Mean | $96,084 | $101,898 |
| Median | $97,801 | $97,891 |
| Interquartile 25% (IQ1) | $81,677 | $82,188 |
| Interquartile 75% (IQ3) | $109,063 | $115,253 |
| Interquartile Range (IQR) | $27,386 | $33,065 |
| Standard Deviation (Sample) | $20,026 | $35,142 |
| Standard Deviation (Population) | $19,924 | $34,796 |
Demographics Similar to Immigrants from Peru and Immigrants from Uganda by Householder Income Ages 45 - 64 years
In terms of householder income ages 45 - 64 years, the demographic groups most similar to Immigrants from Peru are Immigrants from Sierra Leone ($103,227, a difference of 0.050%), Swiss ($103,071, a difference of 0.10%), Irish ($103,067, a difference of 0.10%), Immigrants from Germany ($103,282, a difference of 0.11%), and Scandinavian ($102,969, a difference of 0.20%). Similarly, the demographic groups most similar to Immigrants from Uganda are Luxembourger ($103,536, a difference of 0.050%), Serbian ($103,522, a difference of 0.060%), Czech ($103,507, a difference of 0.070%), Norwegian ($103,682, a difference of 0.090%), and Ugandan ($103,472, a difference of 0.11%).
| Demographics | Rating | Rank | Householder Income Ages 45 - 64 years |
| Brazilians | 88.6 /100 | #135 | Excellent $104,408 |
| Taiwanese | 87.4 /100 | #136 | Excellent $104,180 |
| Hungarians | 85.8 /100 | #137 | Excellent $103,913 |
| Ethiopians | 84.7 /100 | #138 | Excellent $103,736 |
| Immigrants | Oceania | 84.5 /100 | #139 | Excellent $103,705 |
| Norwegians | 84.3 /100 | #140 | Excellent $103,682 |
| Immigrants | Uganda | 83.7 /100 | #141 | Excellent $103,584 |
| Luxembourgers | 83.3 /100 | #142 | Excellent $103,536 |
| Serbians | 83.2 /100 | #143 | Excellent $103,522 |
| Czechs | 83.1 /100 | #144 | Excellent $103,507 |
| Ugandans | 82.9 /100 | #145 | Excellent $103,472 |
| Immigrants | Chile | 82.5 /100 | #146 | Excellent $103,412 |
| Basques | 82.3 /100 | #147 | Excellent $103,387 |
| Immigrants | Germany | 81.5 /100 | #148 | Excellent $103,282 |
| Immigrants | Sierra Leone | 81.1 /100 | #149 | Excellent $103,227 |
| Immigrants | Peru | 80.7 /100 | #150 | Excellent $103,173 |
| Swiss | 79.9 /100 | #151 | Good $103,071 |
| Irish | 79.8 /100 | #152 | Good $103,067 |
| Scandinavians | 79.0 /100 | #153 | Good $102,969 |
| Slovenes | 78.3 /100 | #154 | Good $102,885 |
| Costa Ricans | 77.4 /100 | #155 | Good $102,779 |