Immigrants from Peru vs Immigrants from Caribbean Householder Income Ages 45 - 64 years
COMPARE
Immigrants from Peru
Immigrants from Caribbean
Householder Income Ages 45 - 64 years
Householder Income Ages 45 - 64 years Comparison
Immigrants from Peru
Immigrants from Caribbean
$103,173
HOUSEHOLDER INCOME AGES 45 - 64 YEARS
80.7/ 100
METRIC RATING
150th/ 347
METRIC RANK
$82,513
HOUSEHOLDER INCOME AGES 45 - 64 YEARS
0.0/ 100
METRIC RATING
316th/ 347
METRIC RANK
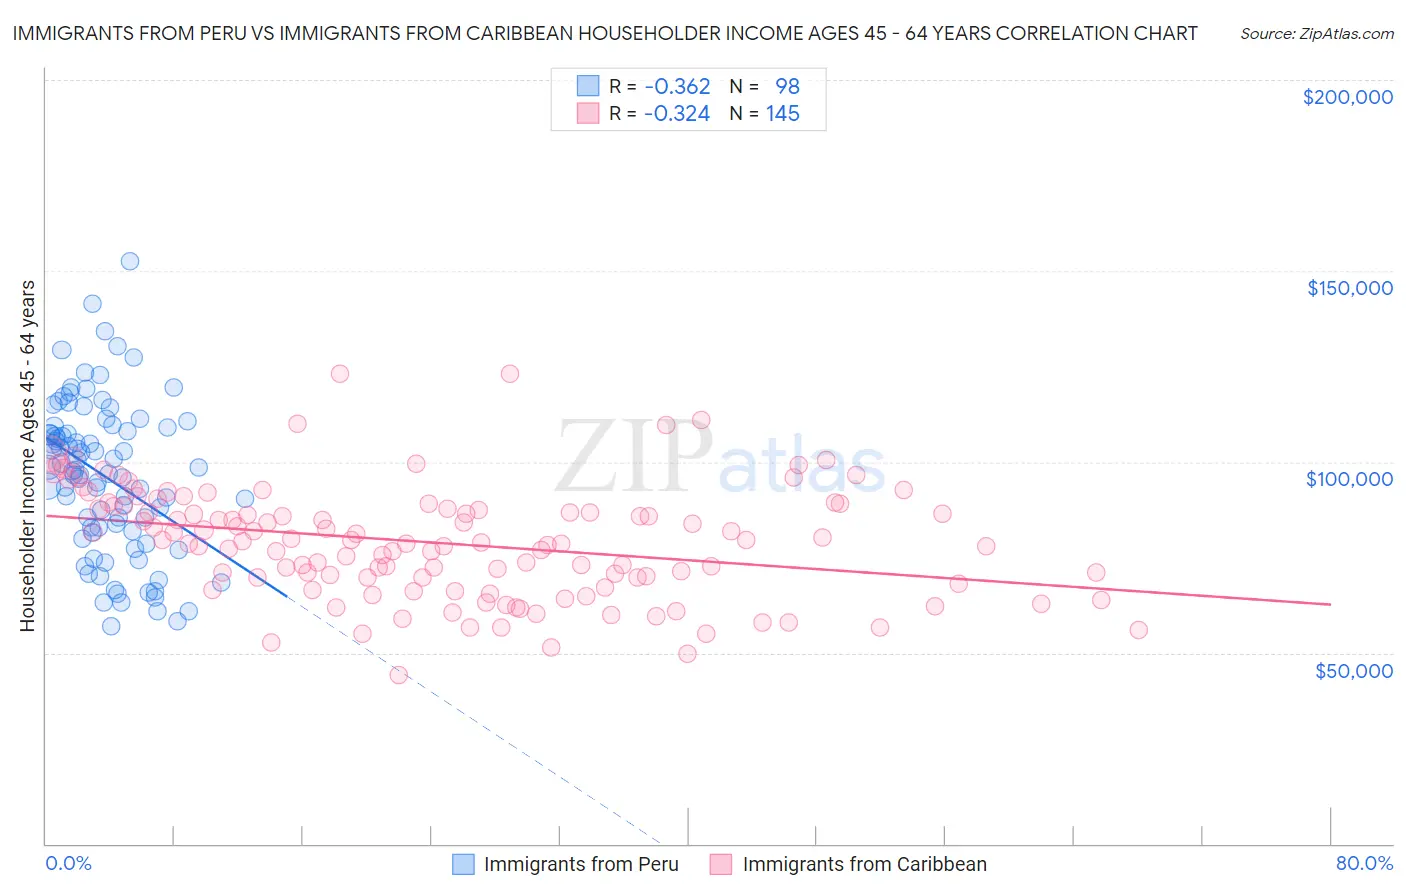
Immigrants from Peru vs Immigrants from Caribbean Householder Income Ages 45 - 64 years Correlation Chart
The statistical analysis conducted on geographies consisting of 328,568,384 people shows a mild negative correlation between the proportion of Immigrants from Peru and household income with householder between the ages 45 and 64 in the United States with a correlation coefficient (R) of -0.362 and weighted average of $103,173. Similarly, the statistical analysis conducted on geographies consisting of 448,858,846 people shows a mild negative correlation between the proportion of Immigrants from Caribbean and household income with householder between the ages 45 and 64 in the United States with a correlation coefficient (R) of -0.324 and weighted average of $82,513, a difference of 25.0%.
Householder Income Ages 45 - 64 years Correlation Summary
| Measurement | Immigrants from Peru | Immigrants from Caribbean |
| Minimum | $56,875 | $44,090 |
| Maximum | $152,612 | $123,114 |
| Range | $95,737 | $79,024 |
| Mean | $96,084 | $78,796 |
| Median | $97,801 | $78,921 |
| Interquartile 25% (IQ1) | $81,677 | $68,886 |
| Interquartile 75% (IQ3) | $109,063 | $87,999 |
| Interquartile Range (IQR) | $27,386 | $19,113 |
| Standard Deviation (Sample) | $20,026 | $14,588 |
| Standard Deviation (Population) | $19,924 | $14,538 |
Similar Demographics by Householder Income Ages 45 - 64 years
Demographics Similar to Immigrants from Peru by Householder Income Ages 45 - 64 years
In terms of householder income ages 45 - 64 years, the demographic groups most similar to Immigrants from Peru are Immigrants from Sierra Leone ($103,227, a difference of 0.050%), Swiss ($103,071, a difference of 0.10%), Irish ($103,067, a difference of 0.10%), Immigrants from Germany ($103,282, a difference of 0.11%), and Scandinavian ($102,969, a difference of 0.20%).
| Demographics | Rating | Rank | Householder Income Ages 45 - 64 years |
| Serbians | 83.2 /100 | #143 | Excellent $103,522 |
| Czechs | 83.1 /100 | #144 | Excellent $103,507 |
| Ugandans | 82.9 /100 | #145 | Excellent $103,472 |
| Immigrants | Chile | 82.5 /100 | #146 | Excellent $103,412 |
| Basques | 82.3 /100 | #147 | Excellent $103,387 |
| Immigrants | Germany | 81.5 /100 | #148 | Excellent $103,282 |
| Immigrants | Sierra Leone | 81.1 /100 | #149 | Excellent $103,227 |
| Immigrants | Peru | 80.7 /100 | #150 | Excellent $103,173 |
| Swiss | 79.9 /100 | #151 | Good $103,071 |
| Irish | 79.8 /100 | #152 | Good $103,067 |
| Scandinavians | 79.0 /100 | #153 | Good $102,969 |
| Slovenes | 78.3 /100 | #154 | Good $102,885 |
| Costa Ricans | 77.4 /100 | #155 | Good $102,779 |
| Carpatho Rusyns | 77.4 /100 | #156 | Good $102,777 |
| Immigrants | Ethiopia | 77.3 /100 | #157 | Good $102,763 |
Demographics Similar to Immigrants from Caribbean by Householder Income Ages 45 - 64 years
In terms of householder income ages 45 - 64 years, the demographic groups most similar to Immigrants from Caribbean are Colville ($82,474, a difference of 0.050%), Paiute ($82,629, a difference of 0.14%), Immigrants from Honduras ($82,697, a difference of 0.22%), U.S. Virgin Islander ($82,736, a difference of 0.27%), and Choctaw ($82,287, a difference of 0.28%).
| Demographics | Rating | Rank | Householder Income Ages 45 - 64 years |
| Immigrants | Dominica | 0.0 /100 | #309 | Tragic $83,311 |
| Immigrants | Haiti | 0.0 /100 | #310 | Tragic $83,257 |
| Immigrants | Bahamas | 0.0 /100 | #311 | Tragic $83,177 |
| Cajuns | 0.0 /100 | #312 | Tragic $83,015 |
| U.S. Virgin Islanders | 0.0 /100 | #313 | Tragic $82,736 |
| Immigrants | Honduras | 0.0 /100 | #314 | Tragic $82,697 |
| Paiute | 0.0 /100 | #315 | Tragic $82,629 |
| Immigrants | Caribbean | 0.0 /100 | #316 | Tragic $82,513 |
| Colville | 0.0 /100 | #317 | Tragic $82,474 |
| Choctaw | 0.0 /100 | #318 | Tragic $82,287 |
| Chickasaw | 0.0 /100 | #319 | Tragic $82,193 |
| Apache | 0.0 /100 | #320 | Tragic $82,184 |
| Yuman | 0.0 /100 | #321 | Tragic $82,139 |
| Sioux | 0.0 /100 | #322 | Tragic $81,750 |
| Bahamians | 0.0 /100 | #323 | Tragic $81,369 |