Immigrants from Pakistan vs Slovene Cognitive Disability
COMPARE
Immigrants from Pakistan
Slovene
Cognitive Disability
Cognitive Disability Comparison
Immigrants from Pakistan
Slovenes
16.4%
COGNITIVE DISABILITY
99.9/ 100
METRIC RATING
27th/ 347
METRIC RANK
16.5%
COGNITIVE DISABILITY
99.9/ 100
METRIC RATING
37th/ 347
METRIC RANK
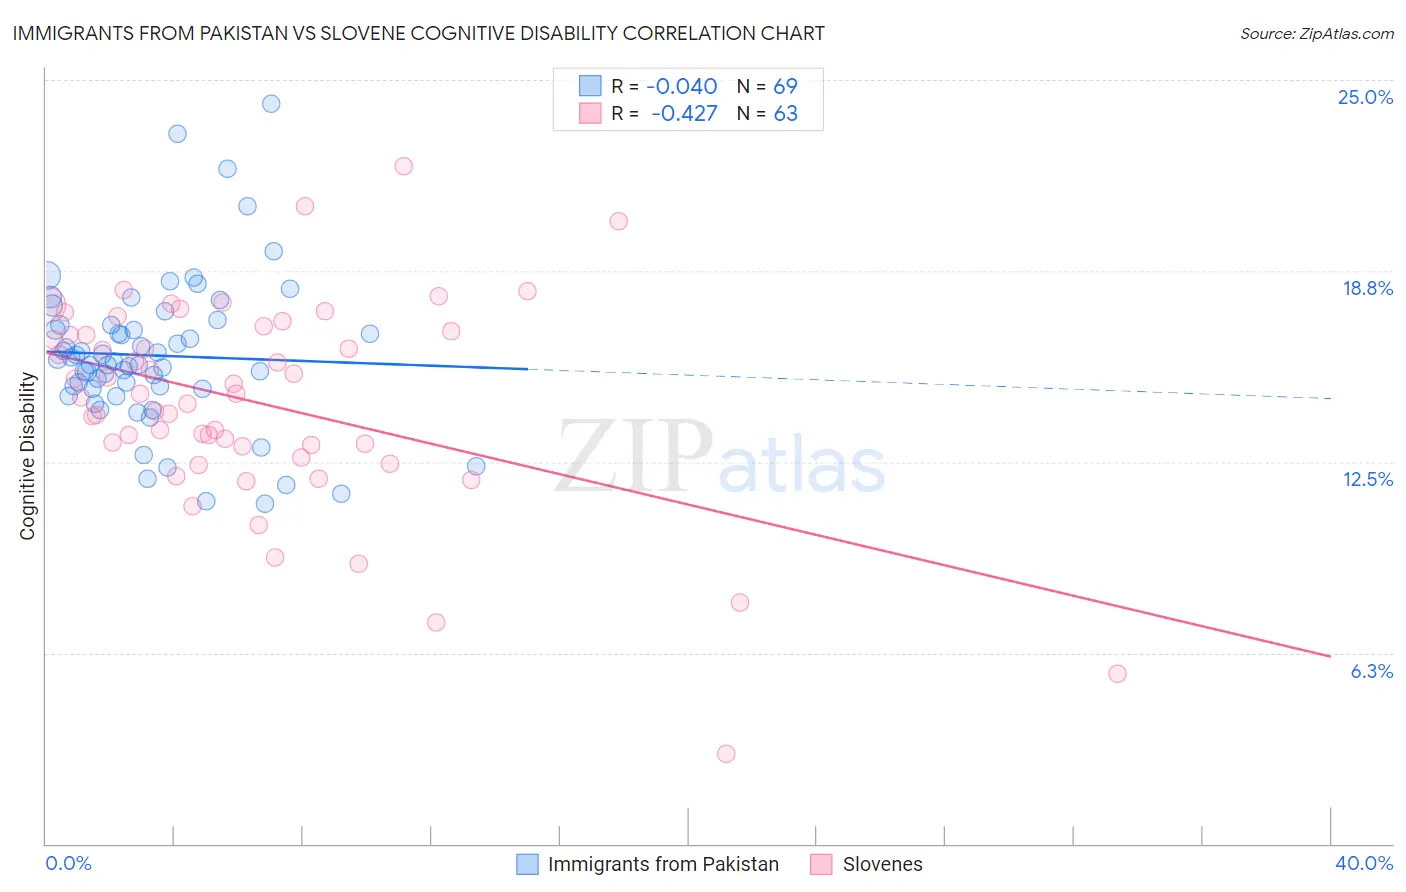
Immigrants from Pakistan vs Slovene Cognitive Disability Correlation Chart
The statistical analysis conducted on geographies consisting of 283,893,099 people shows no correlation between the proportion of Immigrants from Pakistan and percentage of population with cognitive disability in the United States with a correlation coefficient (R) of -0.040 and weighted average of 16.4%. Similarly, the statistical analysis conducted on geographies consisting of 261,350,780 people shows a moderate negative correlation between the proportion of Slovenes and percentage of population with cognitive disability in the United States with a correlation coefficient (R) of -0.427 and weighted average of 16.5%, a difference of 0.41%.
Cognitive Disability Correlation Summary
| Measurement | Immigrants from Pakistan | Slovene |
| Minimum | 11.1% | 2.9% |
| Maximum | 24.2% | 22.2% |
| Range | 13.1% | 19.2% |
| Mean | 16.0% | 14.4% |
| Median | 15.8% | 14.7% |
| Interquartile 25% (IQ1) | 14.9% | 13.0% |
| Interquartile 75% (IQ3) | 17.0% | 16.8% |
| Interquartile Range (IQR) | 2.1% | 3.8% |
| Standard Deviation (Sample) | 2.5% | 3.4% |
| Standard Deviation (Population) | 2.5% | 3.4% |
Demographics Similar to Immigrants from Pakistan and Slovenes by Cognitive Disability
In terms of cognitive disability, the demographic groups most similar to Immigrants from Pakistan are Polish (16.4%, a difference of 0.0%), Immigrants from Croatia (16.4%, a difference of 0.020%), Filipino (16.4%, a difference of 0.030%), Czech (16.4%, a difference of 0.030%), and Luxembourger (16.4%, a difference of 0.050%). Similarly, the demographic groups most similar to Slovenes are Immigrants from Eastern Europe (16.5%, a difference of 0.020%), Bolivian (16.5%, a difference of 0.090%), Immigrants from Belarus (16.5%, a difference of 0.10%), Cuban (16.5%, a difference of 0.11%), and Hungarian (16.5%, a difference of 0.12%).
| Demographics | Rating | Rank | Cognitive Disability |
| Immigrants | South Central Asia | 99.9 /100 | #22 | Exceptional 16.4% |
| Croatians | 99.9 /100 | #23 | Exceptional 16.4% |
| Immigrants | Argentina | 99.9 /100 | #24 | Exceptional 16.4% |
| Luxembourgers | 99.9 /100 | #25 | Exceptional 16.4% |
| Immigrants | Croatia | 99.9 /100 | #26 | Exceptional 16.4% |
| Immigrants | Pakistan | 99.9 /100 | #27 | Exceptional 16.4% |
| Poles | 99.9 /100 | #28 | Exceptional 16.4% |
| Filipinos | 99.9 /100 | #29 | Exceptional 16.4% |
| Czechs | 99.9 /100 | #30 | Exceptional 16.4% |
| Immigrants | Romania | 99.9 /100 | #31 | Exceptional 16.4% |
| Immigrants | Israel | 99.9 /100 | #32 | Exceptional 16.4% |
| Italians | 99.9 /100 | #33 | Exceptional 16.4% |
| Russians | 99.9 /100 | #34 | Exceptional 16.4% |
| Slovaks | 99.9 /100 | #35 | Exceptional 16.4% |
| Greeks | 99.9 /100 | #36 | Exceptional 16.4% |
| Slovenes | 99.9 /100 | #37 | Exceptional 16.5% |
| Immigrants | Eastern Europe | 99.9 /100 | #38 | Exceptional 16.5% |
| Bolivians | 99.9 /100 | #39 | Exceptional 16.5% |
| Immigrants | Belarus | 99.9 /100 | #40 | Exceptional 16.5% |
| Cubans | 99.9 /100 | #41 | Exceptional 16.5% |
| Hungarians | 99.9 /100 | #42 | Exceptional 16.5% |