Immigrants from Oceania vs Yaqui Median Female Earnings
COMPARE
Immigrants from Oceania
Yaqui
Median Female Earnings
Median Female Earnings Comparison
Immigrants from Oceania
Yaqui
$40,297
MEDIAN FEMALE EARNINGS
77.6/ 100
METRIC RATING
154th/ 347
METRIC RANK
$34,943
MEDIAN FEMALE EARNINGS
0.0/ 100
METRIC RATING
312th/ 347
METRIC RANK
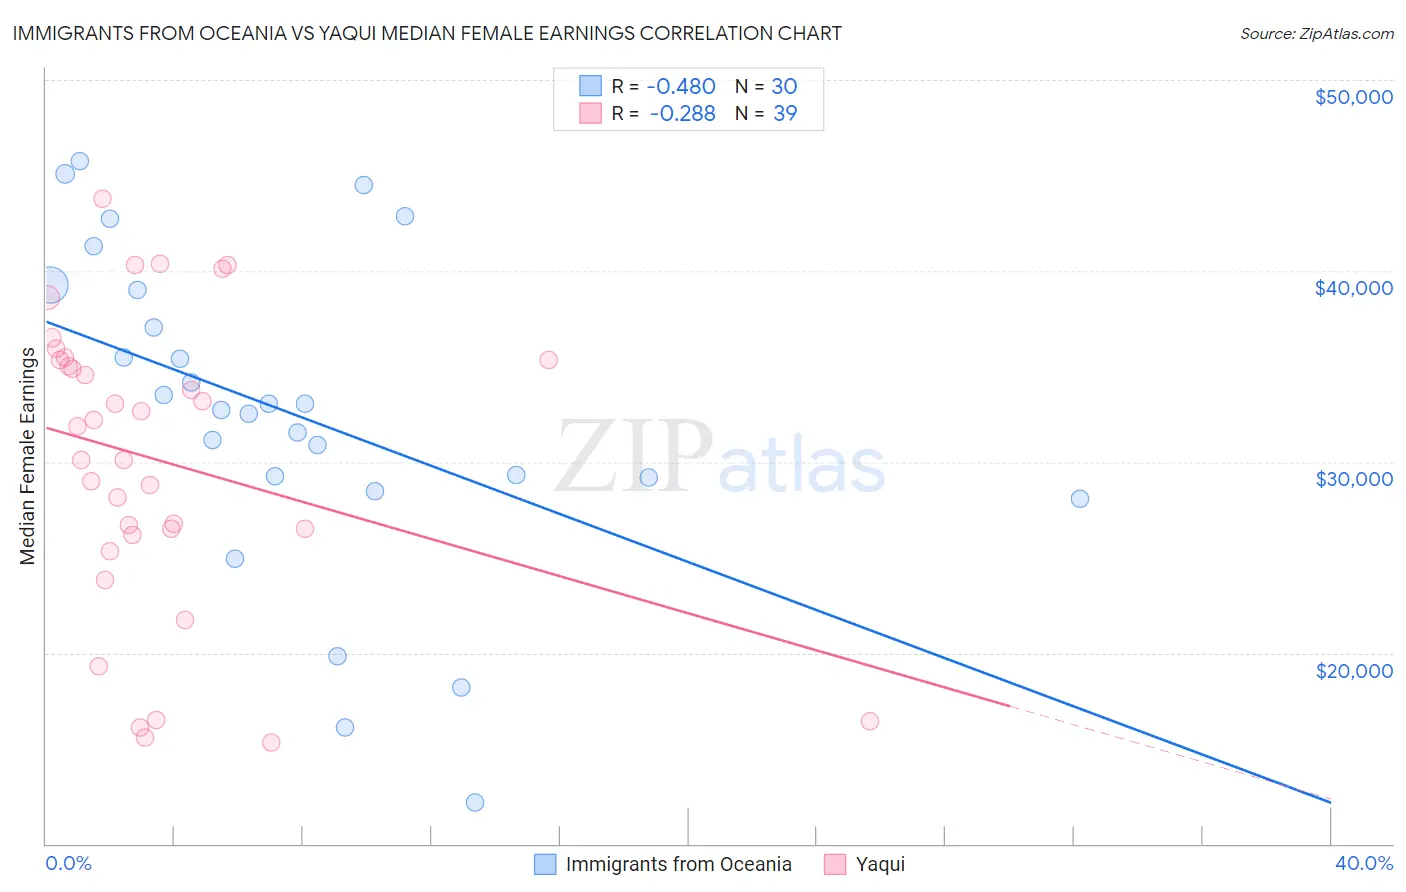
Immigrants from Oceania vs Yaqui Median Female Earnings Correlation Chart
The statistical analysis conducted on geographies consisting of 305,406,455 people shows a moderate negative correlation between the proportion of Immigrants from Oceania and median female earnings in the United States with a correlation coefficient (R) of -0.480 and weighted average of $40,297. Similarly, the statistical analysis conducted on geographies consisting of 107,698,351 people shows a weak negative correlation between the proportion of Yaqui and median female earnings in the United States with a correlation coefficient (R) of -0.288 and weighted average of $34,943, a difference of 15.3%.
Median Female Earnings Correlation Summary
| Measurement | Immigrants from Oceania | Yaqui |
| Minimum | $12,128 | $15,284 |
| Maximum | $45,730 | $43,787 |
| Range | $33,602 | $28,503 |
| Mean | $32,539 | $30,052 |
| Median | $32,878 | $31,854 |
| Interquartile 25% (IQ1) | $29,179 | $26,190 |
| Interquartile 75% (IQ3) | $38,985 | $35,336 |
| Interquartile Range (IQR) | $9,806 | $9,146 |
| Standard Deviation (Sample) | $8,467 | $7,719 |
| Standard Deviation (Population) | $8,325 | $7,619 |
Similar Demographics by Median Female Earnings
Demographics Similar to Immigrants from Oceania by Median Female Earnings
In terms of median female earnings, the demographic groups most similar to Immigrants from Oceania are British West Indian ($40,299, a difference of 0.010%), West Indian ($40,317, a difference of 0.050%), Immigrants from Africa ($40,257, a difference of 0.10%), Immigrants from Armenia ($40,340, a difference of 0.11%), and Immigrants from Cameroon ($40,354, a difference of 0.14%).
| Demographics | Rating | Rank | Median Female Earnings |
| Vietnamese | 80.4 /100 | #147 | Excellent $40,377 |
| Poles | 80.2 /100 | #148 | Excellent $40,371 |
| Immigrants | Cameroon | 79.7 /100 | #149 | Good $40,354 |
| Immigrants | Chile | 79.6 /100 | #150 | Good $40,353 |
| Immigrants | Armenia | 79.2 /100 | #151 | Good $40,340 |
| West Indians | 78.4 /100 | #152 | Good $40,317 |
| British West Indians | 77.7 /100 | #153 | Good $40,299 |
| Immigrants | Oceania | 77.6 /100 | #154 | Good $40,297 |
| Immigrants | Africa | 76.2 /100 | #155 | Good $40,257 |
| Peruvians | 75.3 /100 | #156 | Good $40,234 |
| Portuguese | 73.0 /100 | #157 | Good $40,177 |
| Immigrants | Senegal | 72.2 /100 | #158 | Good $40,157 |
| Immigrants | Vietnam | 72.0 /100 | #159 | Good $40,153 |
| Inupiat | 68.9 /100 | #160 | Good $40,080 |
| Alsatians | 68.0 /100 | #161 | Good $40,060 |
Demographics Similar to Yaqui by Median Female Earnings
In terms of median female earnings, the demographic groups most similar to Yaqui are Cuban ($34,942, a difference of 0.0%), Ute ($34,960, a difference of 0.050%), Apache ($34,895, a difference of 0.14%), Chippewa ($35,003, a difference of 0.17%), and Honduran ($35,013, a difference of 0.20%).
| Demographics | Rating | Rank | Median Female Earnings |
| Bahamians | 0.0 /100 | #305 | Tragic $35,125 |
| Fijians | 0.0 /100 | #306 | Tragic $35,114 |
| Sioux | 0.0 /100 | #307 | Tragic $35,063 |
| Immigrants | Bahamas | 0.0 /100 | #308 | Tragic $35,027 |
| Hondurans | 0.0 /100 | #309 | Tragic $35,013 |
| Chippewa | 0.0 /100 | #310 | Tragic $35,003 |
| Ute | 0.0 /100 | #311 | Tragic $34,960 |
| Yaqui | 0.0 /100 | #312 | Tragic $34,943 |
| Cubans | 0.0 /100 | #313 | Tragic $34,942 |
| Apache | 0.0 /100 | #314 | Tragic $34,895 |
| Pennsylvania Germans | 0.0 /100 | #315 | Tragic $34,802 |
| Cherokee | 0.0 /100 | #316 | Tragic $34,742 |
| Potawatomi | 0.0 /100 | #317 | Tragic $34,739 |
| Immigrants | Yemen | 0.0 /100 | #318 | Tragic $34,693 |
| Shoshone | 0.0 /100 | #319 | Tragic $34,677 |