Immigrants from Oceania vs Immigrants from Eastern Europe Median Earnings
COMPARE
Immigrants from Oceania
Immigrants from Eastern Europe
Median Earnings
Median Earnings Comparison
Immigrants from Oceania
Immigrants from Eastern Europe
$47,617
MEDIAN EARNINGS
84.1/ 100
METRIC RATING
151st/ 347
METRIC RANK
$51,624
MEDIAN EARNINGS
99.9/ 100
METRIC RATING
57th/ 347
METRIC RANK
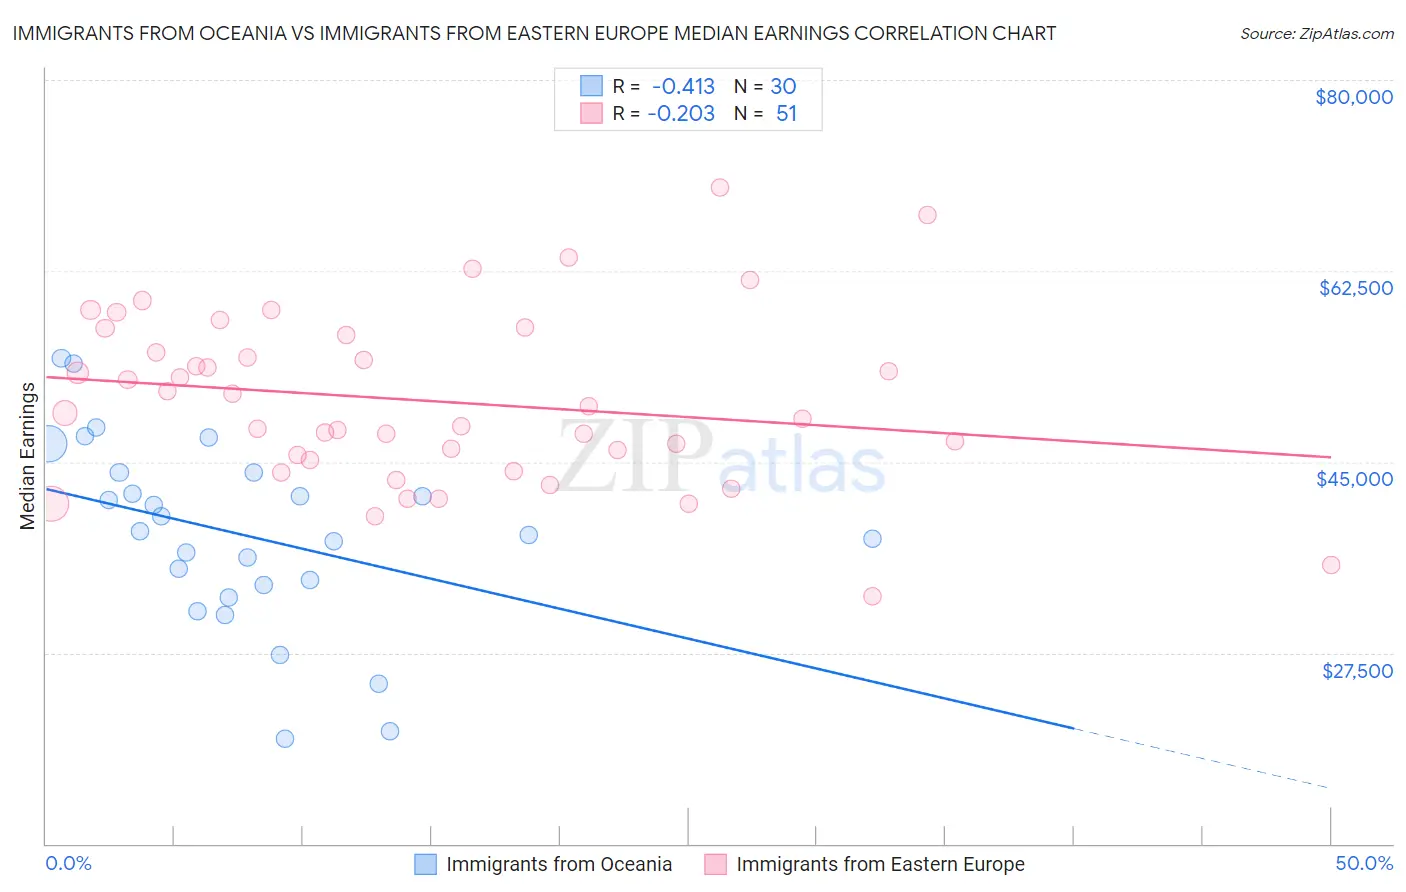
Immigrants from Oceania vs Immigrants from Eastern Europe Median Earnings Correlation Chart
The statistical analysis conducted on geographies consisting of 305,514,828 people shows a moderate negative correlation between the proportion of Immigrants from Oceania and median earnings in the United States with a correlation coefficient (R) of -0.413 and weighted average of $47,617. Similarly, the statistical analysis conducted on geographies consisting of 475,833,062 people shows a weak negative correlation between the proportion of Immigrants from Eastern Europe and median earnings in the United States with a correlation coefficient (R) of -0.203 and weighted average of $51,624, a difference of 8.4%.
Median Earnings Correlation Summary
| Measurement | Immigrants from Oceania | Immigrants from Eastern Europe |
| Minimum | $19,583 | $32,703 |
| Maximum | $54,486 | $70,148 |
| Range | $34,903 | $37,445 |
| Mean | $38,323 | $50,592 |
| Median | $38,462 | $49,479 |
| Interquartile 25% (IQ1) | $33,709 | $45,140 |
| Interquartile 75% (IQ3) | $44,026 | $56,614 |
| Interquartile Range (IQR) | $10,317 | $11,474 |
| Standard Deviation (Sample) | $8,581 | $7,882 |
| Standard Deviation (Population) | $8,437 | $7,805 |
Similar Demographics by Median Earnings
Demographics Similar to Immigrants from Oceania by Median Earnings
In terms of median earnings, the demographic groups most similar to Immigrants from Oceania are Peruvian ($47,628, a difference of 0.020%), Luxembourger ($47,640, a difference of 0.050%), Immigrants from Eritrea ($47,657, a difference of 0.080%), Immigrants from South Eastern Asia ($47,671, a difference of 0.11%), and Immigrants from Germany ($47,566, a difference of 0.11%).
| Demographics | Rating | Rank | Median Earnings |
| Hungarians | 87.1 /100 | #144 | Excellent $47,795 |
| Immigrants | Saudi Arabia | 85.6 /100 | #145 | Excellent $47,704 |
| Immigrants | Chile | 85.5 /100 | #146 | Excellent $47,697 |
| Immigrants | South Eastern Asia | 85.0 /100 | #147 | Excellent $47,671 |
| Immigrants | Eritrea | 84.8 /100 | #148 | Excellent $47,657 |
| Luxembourgers | 84.5 /100 | #149 | Excellent $47,640 |
| Peruvians | 84.2 /100 | #150 | Excellent $47,628 |
| Immigrants | Oceania | 84.1 /100 | #151 | Excellent $47,617 |
| Immigrants | Germany | 83.1 /100 | #152 | Excellent $47,566 |
| Slavs | 81.1 /100 | #153 | Excellent $47,470 |
| Immigrants | Portugal | 77.3 /100 | #154 | Good $47,304 |
| Immigrants | Vietnam | 76.7 /100 | #155 | Good $47,282 |
| Irish | 76.6 /100 | #156 | Good $47,276 |
| Czechs | 75.1 /100 | #157 | Good $47,221 |
| Slovaks | 71.7 /100 | #158 | Good $47,095 |
Demographics Similar to Immigrants from Eastern Europe by Median Earnings
In terms of median earnings, the demographic groups most similar to Immigrants from Eastern Europe are Immigrants from Bolivia ($51,605, a difference of 0.040%), Immigrants from Croatia ($51,581, a difference of 0.080%), Immigrants from Pakistan ($51,693, a difference of 0.13%), Immigrants from Serbia ($51,557, a difference of 0.13%), and Immigrants from Latvia ($51,555, a difference of 0.13%).
| Demographics | Rating | Rank | Median Earnings |
| Immigrants | South Africa | 100.0 /100 | #50 | Exceptional $51,850 |
| Immigrants | Austria | 99.9 /100 | #51 | Exceptional $51,826 |
| Estonians | 99.9 /100 | #52 | Exceptional $51,772 |
| Immigrants | Norway | 99.9 /100 | #53 | Exceptional $51,758 |
| Immigrants | Indonesia | 99.9 /100 | #54 | Exceptional $51,715 |
| Egyptians | 99.9 /100 | #55 | Exceptional $51,701 |
| Immigrants | Pakistan | 99.9 /100 | #56 | Exceptional $51,693 |
| Immigrants | Eastern Europe | 99.9 /100 | #57 | Exceptional $51,624 |
| Immigrants | Bolivia | 99.9 /100 | #58 | Exceptional $51,605 |
| Immigrants | Croatia | 99.9 /100 | #59 | Exceptional $51,581 |
| Immigrants | Serbia | 99.9 /100 | #60 | Exceptional $51,557 |
| Immigrants | Latvia | 99.9 /100 | #61 | Exceptional $51,555 |
| Immigrants | Romania | 99.9 /100 | #62 | Exceptional $51,337 |
| Immigrants | Bulgaria | 99.9 /100 | #63 | Exceptional $51,318 |
| New Zealanders | 99.9 /100 | #64 | Exceptional $51,246 |