Paraguayan vs Immigrants from Spain Householder Income Ages 45 - 64 years
COMPARE
Paraguayan
Immigrants from Spain
Householder Income Ages 45 - 64 years
Householder Income Ages 45 - 64 years Comparison
Paraguayans
Immigrants from Spain
$109,447
HOUSEHOLDER INCOME AGES 45 - 64 YEARS
99.0/ 100
METRIC RATING
76th/ 347
METRIC RANK
$109,051
HOUSEHOLDER INCOME AGES 45 - 64 YEARS
98.8/ 100
METRIC RATING
83rd/ 347
METRIC RANK
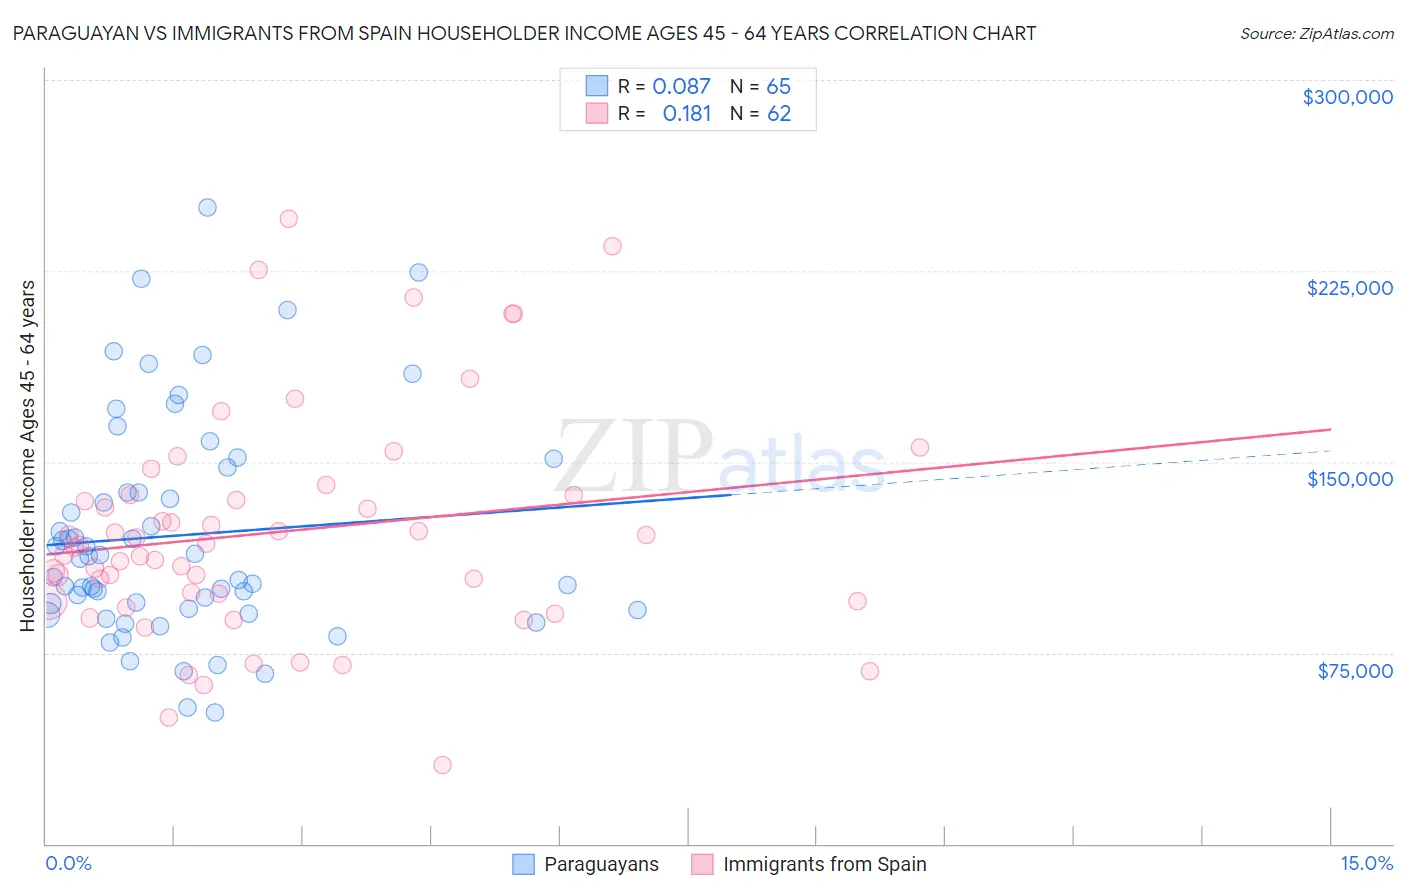
Paraguayan vs Immigrants from Spain Householder Income Ages 45 - 64 years Correlation Chart
The statistical analysis conducted on geographies consisting of 95,076,993 people shows a slight positive correlation between the proportion of Paraguayans and household income with householder between the ages 45 and 64 in the United States with a correlation coefficient (R) of 0.087 and weighted average of $109,447. Similarly, the statistical analysis conducted on geographies consisting of 239,440,989 people shows a poor positive correlation between the proportion of Immigrants from Spain and household income with householder between the ages 45 and 64 in the United States with a correlation coefficient (R) of 0.181 and weighted average of $109,051, a difference of 0.36%.
Householder Income Ages 45 - 64 years Correlation Summary
| Measurement | Paraguayan | Immigrants from Spain |
| Minimum | $51,563 | $30,870 |
| Maximum | $250,001 | $245,443 |
| Range | $198,438 | $214,573 |
| Mean | $121,175 | $122,412 |
| Median | $112,144 | $116,851 |
| Interquartile 25% (IQ1) | $91,944 | $95,313 |
| Interquartile 75% (IQ3) | $142,851 | $137,063 |
| Interquartile Range (IQR) | $50,906 | $41,750 |
| Standard Deviation (Sample) | $43,262 | $44,097 |
| Standard Deviation (Population) | $42,927 | $43,740 |
Demographics Similar to Paraguayans and Immigrants from Spain by Householder Income Ages 45 - 64 years
In terms of householder income ages 45 - 64 years, the demographic groups most similar to Paraguayans are Immigrants from England ($109,446, a difference of 0.0%), Immigrants from Canada ($109,402, a difference of 0.040%), Immigrants from Bulgaria ($109,379, a difference of 0.060%), Jordanian ($109,376, a difference of 0.060%), and Immigrants from Eastern Europe ($109,335, a difference of 0.10%). Similarly, the demographic groups most similar to Immigrants from Spain are Immigrants from North America ($109,198, a difference of 0.14%), Immigrants from Western Europe ($108,824, a difference of 0.21%), Immigrants from Afghanistan ($108,785, a difference of 0.24%), Immigrants from Eastern Europe ($109,335, a difference of 0.26%), and Immigrants from Bulgaria ($109,379, a difference of 0.30%).
| Demographics | Rating | Rank | Householder Income Ages 45 - 64 years |
| Immigrants | Italy | 99.4 /100 | #69 | Exceptional $110,434 |
| Koreans | 99.3 /100 | #70 | Exceptional $110,334 |
| Italians | 99.3 /100 | #71 | Exceptional $110,224 |
| Assyrians/Chaldeans/Syriacs | 99.3 /100 | #72 | Exceptional $110,201 |
| Argentineans | 99.3 /100 | #73 | Exceptional $110,103 |
| Immigrants | Egypt | 99.2 /100 | #74 | Exceptional $109,941 |
| South Africans | 99.1 /100 | #75 | Exceptional $109,719 |
| Paraguayans | 99.0 /100 | #76 | Exceptional $109,447 |
| Immigrants | England | 99.0 /100 | #77 | Exceptional $109,446 |
| Immigrants | Canada | 99.0 /100 | #78 | Exceptional $109,402 |
| Immigrants | Bulgaria | 98.9 /100 | #79 | Exceptional $109,379 |
| Jordanians | 98.9 /100 | #80 | Exceptional $109,376 |
| Immigrants | Eastern Europe | 98.9 /100 | #81 | Exceptional $109,335 |
| Immigrants | North America | 98.8 /100 | #82 | Exceptional $109,198 |
| Immigrants | Spain | 98.8 /100 | #83 | Exceptional $109,051 |
| Immigrants | Western Europe | 98.6 /100 | #84 | Exceptional $108,824 |
| Immigrants | Afghanistan | 98.6 /100 | #85 | Exceptional $108,785 |
| Austrians | 98.5 /100 | #86 | Exceptional $108,692 |
| Tongans | 98.5 /100 | #87 | Exceptional $108,643 |
| Romanians | 98.5 /100 | #88 | Exceptional $108,609 |
| Ukrainians | 98.3 /100 | #89 | Exceptional $108,475 |