Cuban vs Immigrants from Spain Householder Income Ages 45 - 64 years
COMPARE
Cuban
Immigrants from Spain
Householder Income Ages 45 - 64 years
Householder Income Ages 45 - 64 years Comparison
Cubans
Immigrants from Spain
$86,301
HOUSEHOLDER INCOME AGES 45 - 64 YEARS
0.1/ 100
METRIC RATING
289th/ 347
METRIC RANK
$109,051
HOUSEHOLDER INCOME AGES 45 - 64 YEARS
98.8/ 100
METRIC RATING
83rd/ 347
METRIC RANK
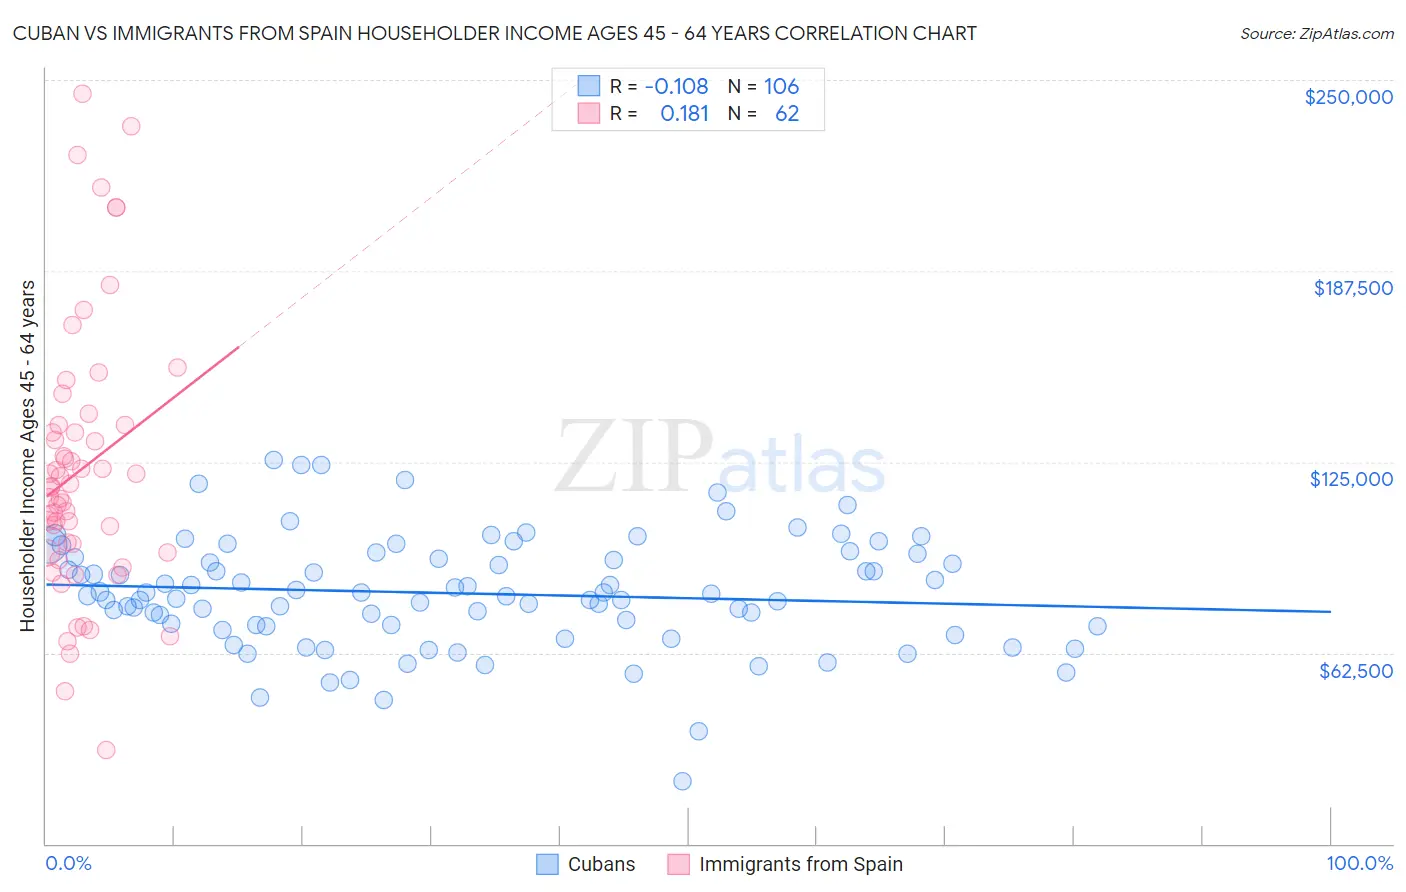
Cuban vs Immigrants from Spain Householder Income Ages 45 - 64 years Correlation Chart
The statistical analysis conducted on geographies consisting of 448,142,263 people shows a poor negative correlation between the proportion of Cubans and household income with householder between the ages 45 and 64 in the United States with a correlation coefficient (R) of -0.108 and weighted average of $86,301. Similarly, the statistical analysis conducted on geographies consisting of 239,440,989 people shows a poor positive correlation between the proportion of Immigrants from Spain and household income with householder between the ages 45 and 64 in the United States with a correlation coefficient (R) of 0.181 and weighted average of $109,051, a difference of 26.4%.
Householder Income Ages 45 - 64 years Correlation Summary
| Measurement | Cuban | Immigrants from Spain |
| Minimum | $20,329 | $30,870 |
| Maximum | $125,619 | $245,443 |
| Range | $105,290 | $214,573 |
| Mean | $81,965 | $122,412 |
| Median | $81,610 | $116,851 |
| Interquartile 25% (IQ1) | $71,341 | $95,313 |
| Interquartile 75% (IQ3) | $93,648 | $137,063 |
| Interquartile Range (IQR) | $22,307 | $41,750 |
| Standard Deviation (Sample) | $18,497 | $44,097 |
| Standard Deviation (Population) | $18,410 | $43,740 |
Similar Demographics by Householder Income Ages 45 - 64 years
Demographics Similar to Cubans by Householder Income Ages 45 - 64 years
In terms of householder income ages 45 - 64 years, the demographic groups most similar to Cubans are Immigrants from St. Vincent and the Grenadines ($86,394, a difference of 0.11%), Bangladeshi ($86,402, a difference of 0.12%), Cherokee ($86,125, a difference of 0.20%), Immigrants from Guatemala ($86,573, a difference of 0.32%), and Blackfeet ($86,595, a difference of 0.34%).
| Demographics | Rating | Rank | Householder Income Ages 45 - 64 years |
| Senegalese | 0.1 /100 | #282 | Tragic $86,897 |
| Mexicans | 0.1 /100 | #283 | Tragic $86,816 |
| Central American Indians | 0.1 /100 | #284 | Tragic $86,764 |
| Blackfeet | 0.1 /100 | #285 | Tragic $86,595 |
| Immigrants | Guatemala | 0.1 /100 | #286 | Tragic $86,573 |
| Bangladeshis | 0.1 /100 | #287 | Tragic $86,402 |
| Immigrants | St. Vincent and the Grenadines | 0.1 /100 | #288 | Tragic $86,394 |
| Cubans | 0.1 /100 | #289 | Tragic $86,301 |
| Cherokee | 0.1 /100 | #290 | Tragic $86,125 |
| Hispanics or Latinos | 0.1 /100 | #291 | Tragic $86,006 |
| Immigrants | Central America | 0.1 /100 | #292 | Tragic $85,965 |
| Comanche | 0.1 /100 | #293 | Tragic $85,787 |
| British West Indians | 0.1 /100 | #294 | Tragic $85,571 |
| Immigrants | Grenada | 0.1 /100 | #295 | Tragic $85,552 |
| Immigrants | Zaire | 0.1 /100 | #296 | Tragic $85,207 |
Demographics Similar to Immigrants from Spain by Householder Income Ages 45 - 64 years
In terms of householder income ages 45 - 64 years, the demographic groups most similar to Immigrants from Spain are Immigrants from North America ($109,198, a difference of 0.14%), Immigrants from Western Europe ($108,824, a difference of 0.21%), Immigrants from Afghanistan ($108,785, a difference of 0.24%), Immigrants from Eastern Europe ($109,335, a difference of 0.26%), and Immigrants from Bulgaria ($109,379, a difference of 0.30%).
| Demographics | Rating | Rank | Householder Income Ages 45 - 64 years |
| Paraguayans | 99.0 /100 | #76 | Exceptional $109,447 |
| Immigrants | England | 99.0 /100 | #77 | Exceptional $109,446 |
| Immigrants | Canada | 99.0 /100 | #78 | Exceptional $109,402 |
| Immigrants | Bulgaria | 98.9 /100 | #79 | Exceptional $109,379 |
| Jordanians | 98.9 /100 | #80 | Exceptional $109,376 |
| Immigrants | Eastern Europe | 98.9 /100 | #81 | Exceptional $109,335 |
| Immigrants | North America | 98.8 /100 | #82 | Exceptional $109,198 |
| Immigrants | Spain | 98.8 /100 | #83 | Exceptional $109,051 |
| Immigrants | Western Europe | 98.6 /100 | #84 | Exceptional $108,824 |
| Immigrants | Afghanistan | 98.6 /100 | #85 | Exceptional $108,785 |
| Austrians | 98.5 /100 | #86 | Exceptional $108,692 |
| Tongans | 98.5 /100 | #87 | Exceptional $108,643 |
| Romanians | 98.5 /100 | #88 | Exceptional $108,609 |
| Ukrainians | 98.3 /100 | #89 | Exceptional $108,475 |
| Immigrants | Philippines | 98.3 /100 | #90 | Exceptional $108,471 |