Immigrants from Norway vs South African 9th Grade
COMPARE
Immigrants from Norway
South African
9th Grade
9th Grade Comparison
Immigrants from Norway
South Africans
95.5%
9TH GRADE
97.1/ 100
METRIC RATING
106th/ 347
METRIC RANK
95.6%
9TH GRADE
98.8/ 100
METRIC RATING
90th/ 347
METRIC RANK
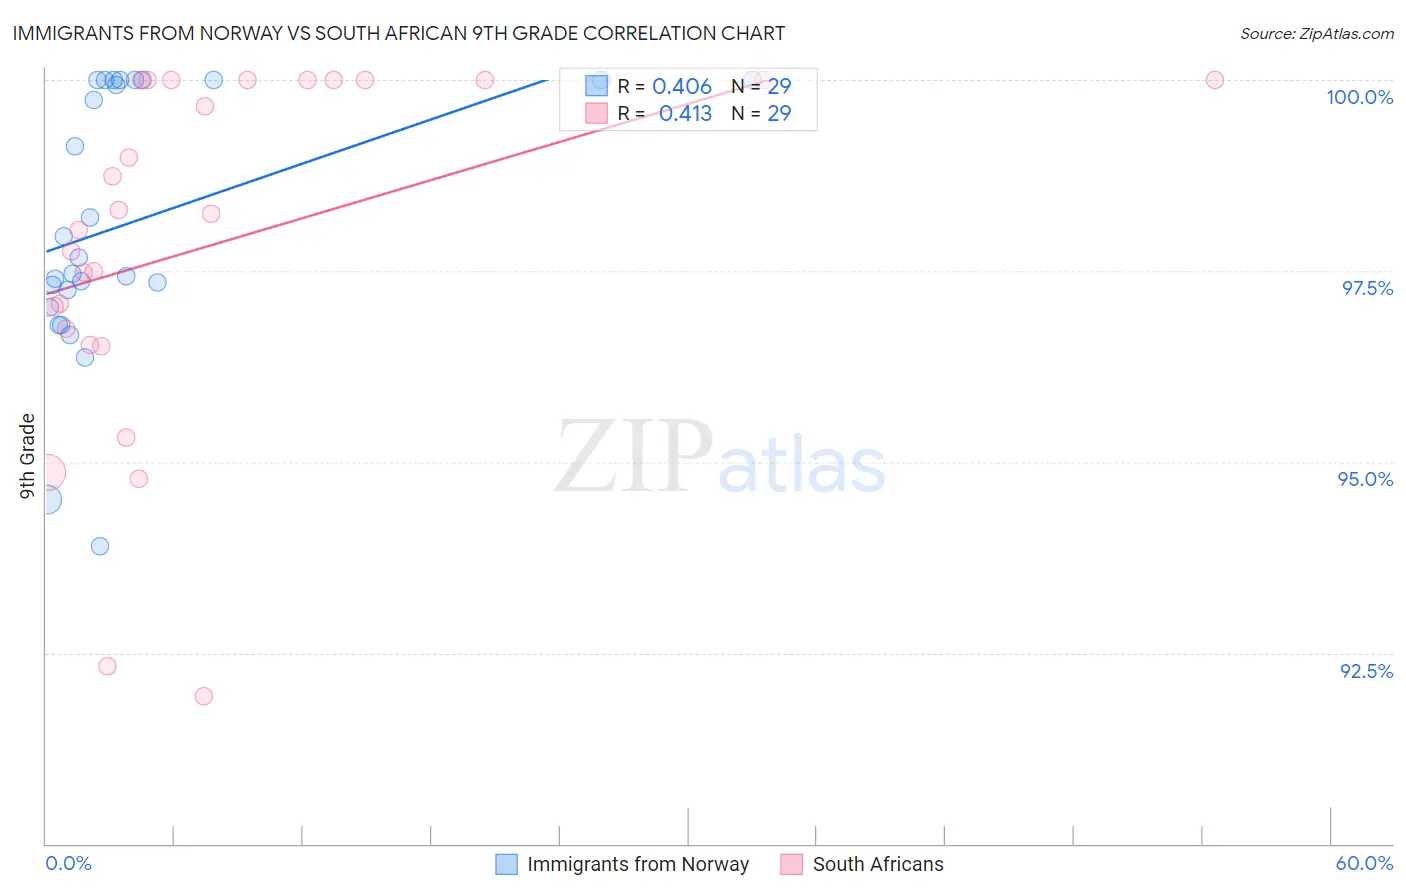
Immigrants from Norway vs South African 9th Grade Correlation Chart
The statistical analysis conducted on geographies consisting of 116,716,420 people shows a moderate positive correlation between the proportion of Immigrants from Norway and percentage of population with at least 9th grade education in the United States with a correlation coefficient (R) of 0.406 and weighted average of 95.5%. Similarly, the statistical analysis conducted on geographies consisting of 182,604,532 people shows a moderate positive correlation between the proportion of South Africans and percentage of population with at least 9th grade education in the United States with a correlation coefficient (R) of 0.413 and weighted average of 95.6%, a difference of 0.16%.
9th Grade Correlation Summary
| Measurement | Immigrants from Norway | South African |
| Minimum | 93.9% | 91.9% |
| Maximum | 100.0% | 100.0% |
| Range | 6.1% | 8.1% |
| Mean | 98.1% | 97.9% |
| Median | 97.7% | 98.2% |
| Interquartile 25% (IQ1) | 97.1% | 96.6% |
| Interquartile 75% (IQ3) | 100.0% | 100.0% |
| Interquartile Range (IQR) | 2.9% | 3.4% |
| Standard Deviation (Sample) | 1.7% | 2.3% |
| Standard Deviation (Population) | 1.7% | 2.3% |
Demographics Similar to Immigrants from Norway and South Africans by 9th Grade
In terms of 9th grade, the demographic groups most similar to Immigrants from Norway are Immigrants from France (95.5%, a difference of 0.010%), Syrian (95.5%, a difference of 0.020%), Immigrants from Zimbabwe (95.5%, a difference of 0.020%), Chickasaw (95.5%, a difference of 0.020%), and Immigrants from Switzerland (95.5%, a difference of 0.040%). Similarly, the demographic groups most similar to South Africans are Immigrants from Czechoslovakia (95.7%, a difference of 0.010%), Yugoslavian (95.7%, a difference of 0.010%), Creek (95.6%, a difference of 0.010%), Immigrants from Saudi Arabia (95.6%, a difference of 0.010%), and Immigrants from Germany (95.6%, a difference of 0.020%).
| Demographics | Rating | Rank | 9th Grade |
| Immigrants | Czechoslovakia | 98.9 /100 | #88 | Exceptional 95.7% |
| Yugoslavians | 98.9 /100 | #89 | Exceptional 95.7% |
| South Africans | 98.8 /100 | #90 | Exceptional 95.6% |
| Creek | 98.8 /100 | #91 | Exceptional 95.6% |
| Immigrants | Saudi Arabia | 98.8 /100 | #92 | Exceptional 95.6% |
| Immigrants | Germany | 98.7 /100 | #93 | Exceptional 95.6% |
| Immigrants | Latvia | 98.7 /100 | #94 | Exceptional 95.6% |
| Americans | 98.5 /100 | #95 | Exceptional 95.6% |
| Filipinos | 98.5 /100 | #96 | Exceptional 95.6% |
| Delaware | 98.4 /100 | #97 | Exceptional 95.6% |
| Immigrants | Japan | 98.4 /100 | #98 | Exceptional 95.6% |
| Menominee | 98.3 /100 | #99 | Exceptional 95.6% |
| Lebanese | 98.1 /100 | #100 | Exceptional 95.6% |
| Immigrants | Moldova | 97.9 /100 | #101 | Exceptional 95.5% |
| Immigrants | Switzerland | 97.7 /100 | #102 | Exceptional 95.5% |
| Potawatomi | 97.7 /100 | #103 | Exceptional 95.5% |
| Syrians | 97.4 /100 | #104 | Exceptional 95.5% |
| Immigrants | France | 97.4 /100 | #105 | Exceptional 95.5% |
| Immigrants | Norway | 97.1 /100 | #106 | Exceptional 95.5% |
| Immigrants | Zimbabwe | 96.9 /100 | #107 | Exceptional 95.5% |
| Chickasaw | 96.8 /100 | #108 | Exceptional 95.5% |