Immigrants from Norway vs South African Unemployment Among Ages 20 to 24 years
COMPARE
Immigrants from Norway
South African
Unemployment Among Ages 20 to 24 years
Unemployment Among Ages 20 to 24 years Comparison
Immigrants from Norway
South Africans
10.1%
UNEMPLOYMENT AMONG AGES 20 TO 24 YEARS
85.3/ 100
METRIC RATING
127th/ 347
METRIC RANK
10.1%
UNEMPLOYMENT AMONG AGES 20 TO 24 YEARS
87.8/ 100
METRIC RATING
121st/ 347
METRIC RANK
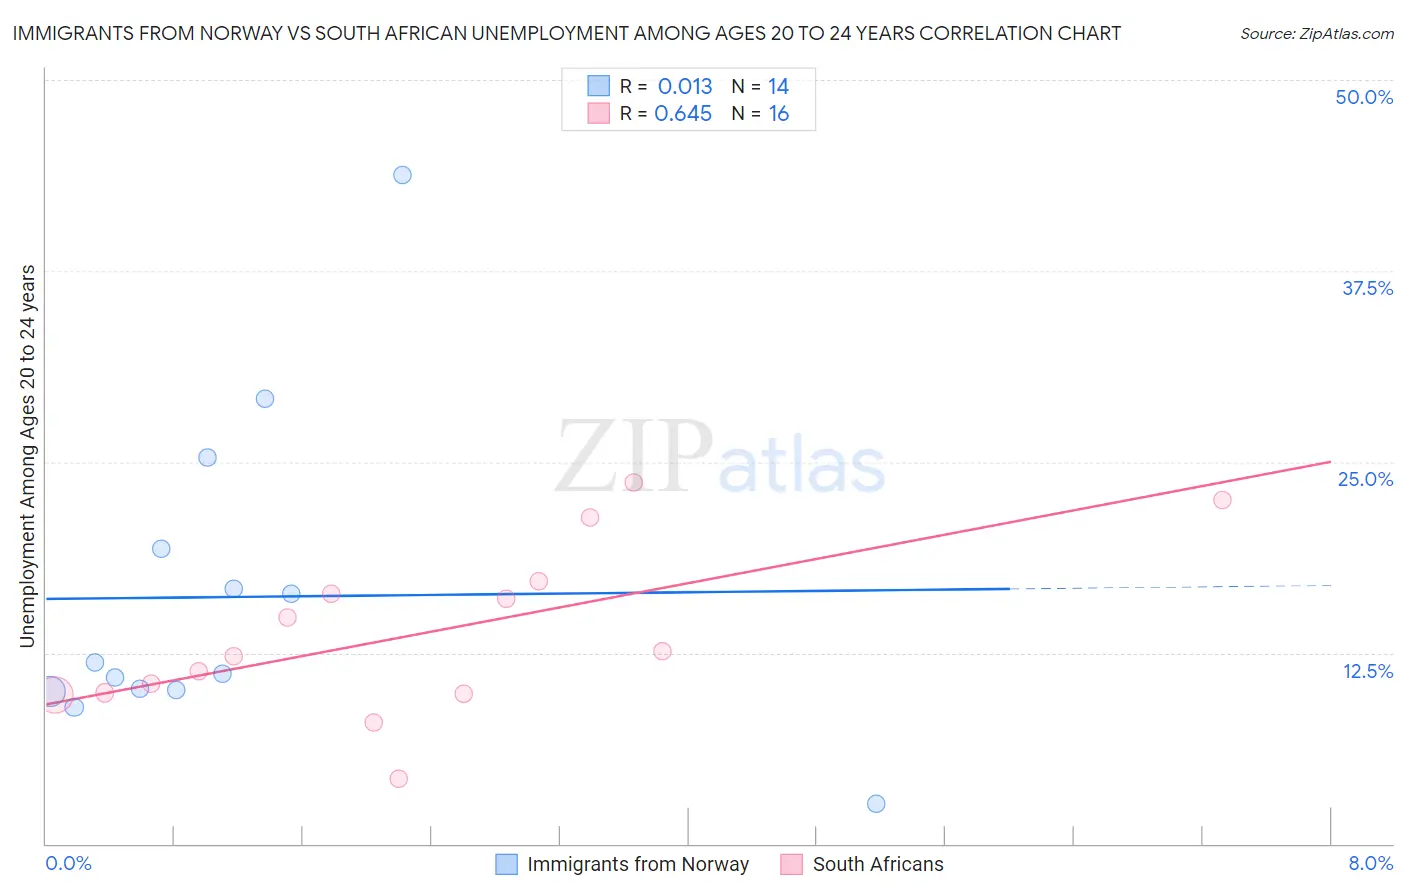
Immigrants from Norway vs South African Unemployment Among Ages 20 to 24 years Correlation Chart
The statistical analysis conducted on geographies consisting of 115,468,056 people shows no correlation between the proportion of Immigrants from Norway and unemployment rate among population between the ages 20 and 24 in the United States with a correlation coefficient (R) of 0.013 and weighted average of 10.1%. Similarly, the statistical analysis conducted on geographies consisting of 179,868,071 people shows a significant positive correlation between the proportion of South Africans and unemployment rate among population between the ages 20 and 24 in the United States with a correlation coefficient (R) of 0.645 and weighted average of 10.1%, a difference of 0.20%.
Unemployment Among Ages 20 to 24 years Correlation Summary
| Measurement | Immigrants from Norway | South African |
| Minimum | 2.6% | 4.3% |
| Maximum | 43.8% | 23.7% |
| Range | 41.2% | 19.4% |
| Mean | 16.2% | 13.8% |
| Median | 11.5% | 12.4% |
| Interquartile 25% (IQ1) | 10.0% | 9.8% |
| Interquartile 75% (IQ3) | 19.3% | 16.8% |
| Interquartile Range (IQR) | 9.3% | 6.9% |
| Standard Deviation (Sample) | 10.5% | 5.5% |
| Standard Deviation (Population) | 10.2% | 5.3% |
Demographics Similar to Immigrants from Norway and South Africans by Unemployment Among Ages 20 to 24 years
In terms of unemployment among ages 20 to 24 years, the demographic groups most similar to Immigrants from Norway are Immigrants from Brazil (10.1%, a difference of 0.030%), Immigrants from South Central Asia (10.1%, a difference of 0.050%), Jordanian (10.1%, a difference of 0.060%), Spanish (10.1%, a difference of 0.070%), and Immigrants from Lithuania (10.1%, a difference of 0.080%). Similarly, the demographic groups most similar to South Africans are Immigrants from Canada (10.1%, a difference of 0.030%), French (10.1%, a difference of 0.040%), White/Caucasian (10.1%, a difference of 0.040%), Immigrants from Iraq (10.1%, a difference of 0.060%), and Paraguayan (10.1%, a difference of 0.070%).
| Demographics | Rating | Rank | Unemployment Among Ages 20 to 24 years |
| Ottawa | 90.8 /100 | #114 | Exceptional 10.1% |
| Immigrants | Morocco | 90.5 /100 | #115 | Exceptional 10.1% |
| Basques | 89.8 /100 | #116 | Excellent 10.1% |
| Immigrants | Uruguay | 89.6 /100 | #117 | Excellent 10.1% |
| Paraguayans | 88.6 /100 | #118 | Excellent 10.1% |
| French | 88.2 /100 | #119 | Excellent 10.1% |
| Immigrants | Canada | 88.2 /100 | #120 | Excellent 10.1% |
| South Africans | 87.8 /100 | #121 | Excellent 10.1% |
| Whites/Caucasians | 87.4 /100 | #122 | Excellent 10.1% |
| Immigrants | Iraq | 87.1 /100 | #123 | Excellent 10.1% |
| Immigrants | Japan | 86.5 /100 | #124 | Excellent 10.1% |
| Spanish | 86.1 /100 | #125 | Excellent 10.1% |
| Jordanians | 86.1 /100 | #126 | Excellent 10.1% |
| Immigrants | Norway | 85.3 /100 | #127 | Excellent 10.1% |
| Immigrants | Brazil | 84.9 /100 | #128 | Excellent 10.1% |
| Immigrants | South Central Asia | 84.6 /100 | #129 | Excellent 10.1% |
| Immigrants | Lithuania | 84.2 /100 | #130 | Excellent 10.1% |
| Seminole | 84.2 /100 | #131 | Excellent 10.1% |
| Immigrants | South Eastern Asia | 84.0 /100 | #132 | Excellent 10.1% |
| Austrians | 83.9 /100 | #133 | Excellent 10.2% |
| Romanians | 83.8 /100 | #134 | Excellent 10.2% |