Immigrants from Northern Europe vs South American Householder Income Over 65 years
COMPARE
Immigrants from Northern Europe
South American
Householder Income Over 65 years
Householder Income Over 65 years Comparison
Immigrants from Northern Europe
South Americans
$69,003
HOUSEHOLDER INCOME OVER 65 YEARS
100.0/ 100
METRIC RATING
30th/ 347
METRIC RANK
$59,854
HOUSEHOLDER INCOME OVER 65 YEARS
23.8/ 100
METRIC RATING
192nd/ 347
METRIC RANK
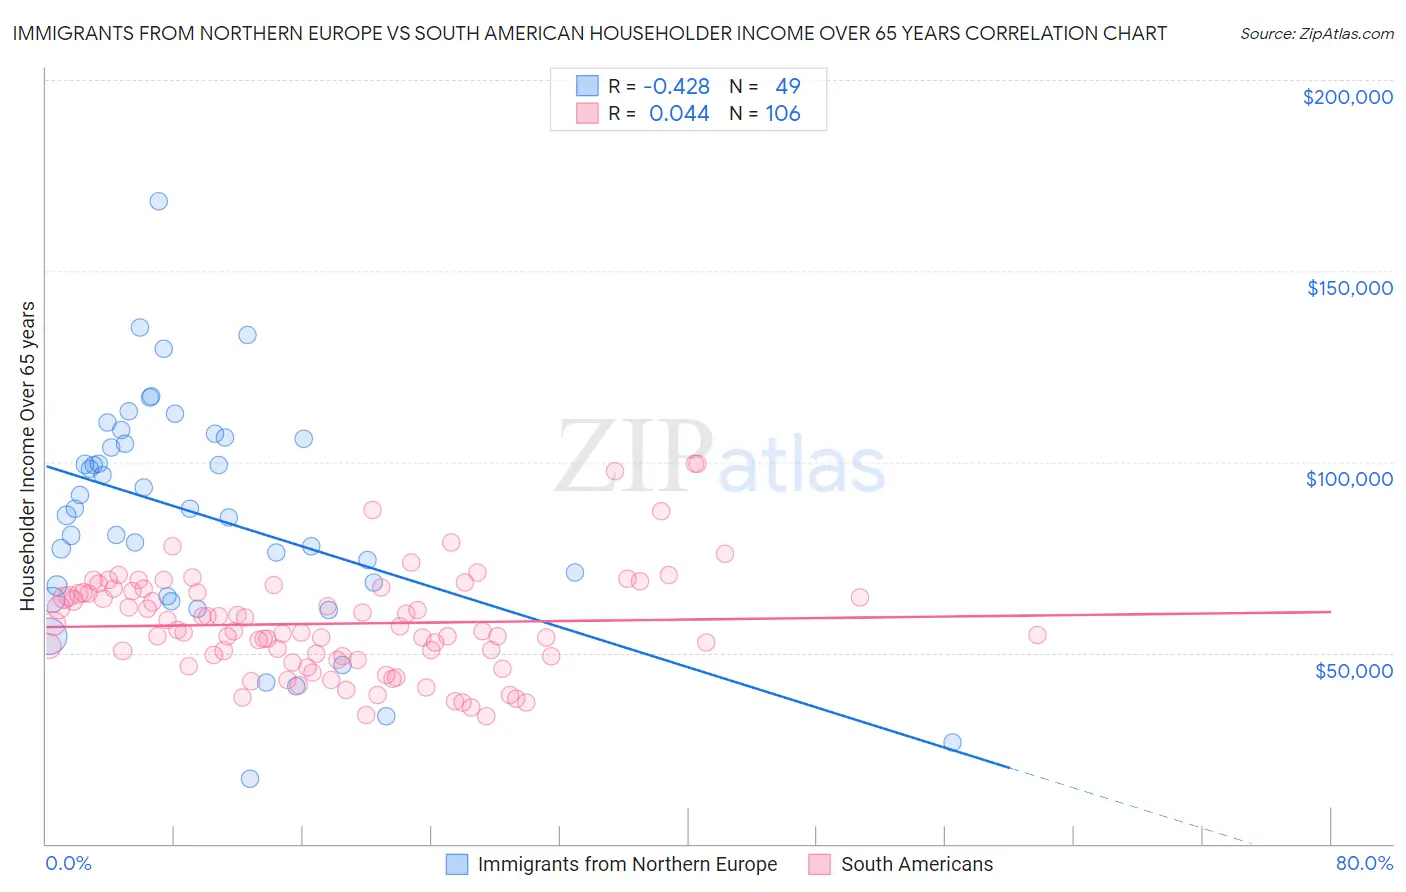
Immigrants from Northern Europe vs South American Householder Income Over 65 years Correlation Chart
The statistical analysis conducted on geographies consisting of 475,347,578 people shows a moderate negative correlation between the proportion of Immigrants from Northern Europe and household income with householder over the age of 65 in the United States with a correlation coefficient (R) of -0.428 and weighted average of $69,003. Similarly, the statistical analysis conducted on geographies consisting of 491,344,983 people shows no correlation between the proportion of South Americans and household income with householder over the age of 65 in the United States with a correlation coefficient (R) of 0.044 and weighted average of $59,854, a difference of 15.3%.
Householder Income Over 65 years Correlation Summary
| Measurement | Immigrants from Northern Europe | South American |
| Minimum | $16,875 | $33,510 |
| Maximum | $168,214 | $99,659 |
| Range | $151,339 | $66,149 |
| Mean | $86,244 | $57,616 |
| Median | $87,597 | $55,802 |
| Interquartile 25% (IQ1) | $66,142 | $49,066 |
| Interquartile 75% (IQ3) | $106,144 | $65,825 |
| Interquartile Range (IQR) | $40,003 | $16,759 |
| Standard Deviation (Sample) | $29,698 | $13,490 |
| Standard Deviation (Population) | $29,393 | $13,426 |
Similar Demographics by Householder Income Over 65 years
Demographics Similar to Immigrants from Northern Europe by Householder Income Over 65 years
In terms of householder income over 65 years, the demographic groups most similar to Immigrants from Northern Europe are Afghan ($68,951, a difference of 0.070%), Immigrants from Australia ($69,164, a difference of 0.23%), Immigrants from China ($69,174, a difference of 0.25%), Asian ($68,822, a difference of 0.26%), and Immigrants from Denmark ($68,801, a difference of 0.29%).
| Demographics | Rating | Rank | Householder Income Over 65 years |
| Immigrants | Japan | 100.0 /100 | #23 | Exceptional $69,774 |
| Immigrants | Sweden | 100.0 /100 | #24 | Exceptional $69,722 |
| Immigrants | Belgium | 100.0 /100 | #25 | Exceptional $69,703 |
| Immigrants | Sri Lanka | 100.0 /100 | #26 | Exceptional $69,426 |
| Immigrants | Switzerland | 100.0 /100 | #27 | Exceptional $69,343 |
| Immigrants | China | 100.0 /100 | #28 | Exceptional $69,174 |
| Immigrants | Australia | 100.0 /100 | #29 | Exceptional $69,164 |
| Immigrants | Northern Europe | 100.0 /100 | #30 | Exceptional $69,003 |
| Afghans | 100.0 /100 | #31 | Exceptional $68,951 |
| Asians | 100.0 /100 | #32 | Exceptional $68,822 |
| Immigrants | Denmark | 100.0 /100 | #33 | Exceptional $68,801 |
| Immigrants | Ireland | 100.0 /100 | #34 | Exceptional $68,495 |
| Tongans | 100.0 /100 | #35 | Exceptional $68,235 |
| Immigrants | Austria | 99.9 /100 | #36 | Exceptional $68,208 |
| Turks | 99.9 /100 | #37 | Exceptional $68,037 |
Demographics Similar to South Americans by Householder Income Over 65 years
In terms of householder income over 65 years, the demographic groups most similar to South Americans are Immigrants from Costa Rica ($59,848, a difference of 0.010%), Immigrants from Africa ($59,837, a difference of 0.030%), Immigrants from Iraq ($59,824, a difference of 0.050%), Belgian ($59,915, a difference of 0.10%), and Puget Sound Salish ($59,934, a difference of 0.13%).
| Demographics | Rating | Rank | Householder Income Over 65 years |
| Albanians | 32.0 /100 | #185 | Fair $60,249 |
| Slovenes | 31.8 /100 | #186 | Fair $60,241 |
| Immigrants | Thailand | 31.3 /100 | #187 | Fair $60,217 |
| Immigrants | Eritrea | 28.6 /100 | #188 | Fair $60,096 |
| Ghanaians | 27.5 /100 | #189 | Fair $60,043 |
| Puget Sound Salish | 25.3 /100 | #190 | Fair $59,934 |
| Belgians | 24.9 /100 | #191 | Fair $59,915 |
| South Americans | 23.8 /100 | #192 | Fair $59,854 |
| Immigrants | Costa Rica | 23.6 /100 | #193 | Fair $59,848 |
| Immigrants | Africa | 23.4 /100 | #194 | Fair $59,837 |
| Immigrants | Iraq | 23.2 /100 | #195 | Fair $59,824 |
| Germans | 21.5 /100 | #196 | Fair $59,730 |
| Immigrants | Kenya | 21.1 /100 | #197 | Fair $59,710 |
| Moroccans | 20.7 /100 | #198 | Fair $59,683 |
| Immigrants | Immigrants | 20.2 /100 | #199 | Fair $59,656 |