Immigrants from Northern Europe vs Immigrants from Zaire Householder Income Ages 25 - 44 years
COMPARE
Immigrants from Northern Europe
Immigrants from Zaire
Householder Income Ages 25 - 44 years
Householder Income Ages 25 - 44 years Comparison
Immigrants from Northern Europe
Immigrants from Zaire
$111,676
HOUSEHOLDER INCOME AGES 25 - 44 YEARS
100.0/ 100
METRIC RATING
25th/ 347
METRIC RANK
$78,045
HOUSEHOLDER INCOME AGES 25 - 44 YEARS
0.0/ 100
METRIC RATING
321st/ 347
METRIC RANK
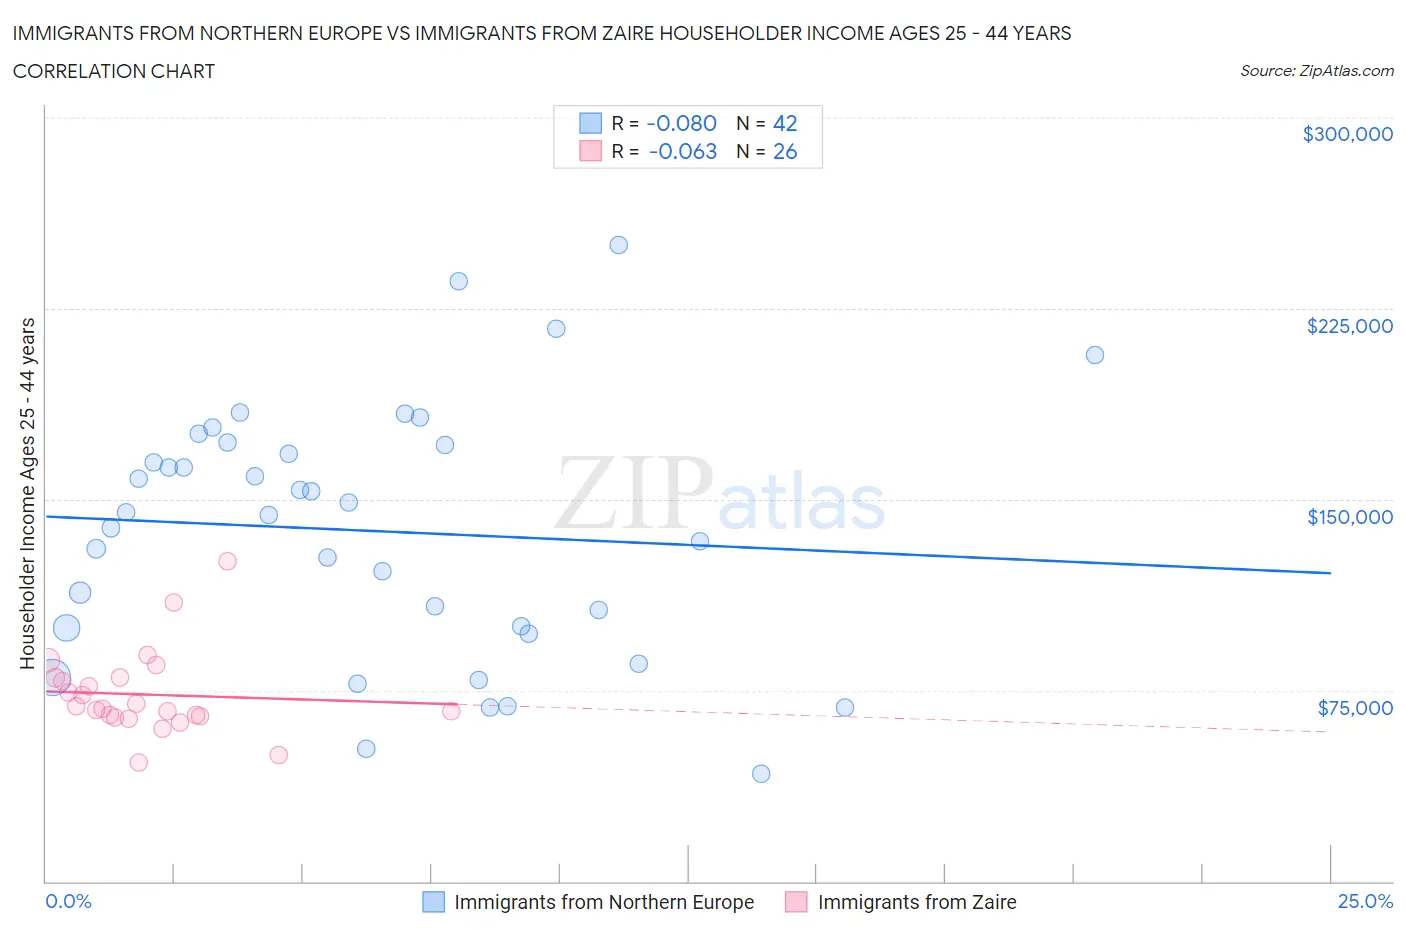
Immigrants from Northern Europe vs Immigrants from Zaire Householder Income Ages 25 - 44 years Correlation Chart
The statistical analysis conducted on geographies consisting of 475,162,108 people shows a slight negative correlation between the proportion of Immigrants from Northern Europe and household income with householder between the ages 25 and 44 in the United States with a correlation coefficient (R) of -0.080 and weighted average of $111,676. Similarly, the statistical analysis conducted on geographies consisting of 107,186,702 people shows a slight negative correlation between the proportion of Immigrants from Zaire and household income with householder between the ages 25 and 44 in the United States with a correlation coefficient (R) of -0.063 and weighted average of $78,045, a difference of 43.1%.
Householder Income Ages 25 - 44 years Correlation Summary
| Measurement | Immigrants from Northern Europe | Immigrants from Zaire |
| Minimum | $42,036 | $46,875 |
| Maximum | $250,001 | $125,889 |
| Range | $207,965 | $79,014 |
| Mean | $137,540 | $73,350 |
| Median | $144,261 | $68,084 |
| Interquartile 25% (IQ1) | $99,498 | $64,948 |
| Interquartile 75% (IQ3) | $171,539 | $79,800 |
| Interquartile Range (IQR) | $72,041 | $14,852 |
| Standard Deviation (Sample) | $49,597 | $16,583 |
| Standard Deviation (Population) | $49,003 | $16,261 |
Similar Demographics by Householder Income Ages 25 - 44 years
Demographics Similar to Immigrants from Northern Europe by Householder Income Ages 25 - 44 years
In terms of householder income ages 25 - 44 years, the demographic groups most similar to Immigrants from Northern Europe are Immigrants from Sweden ($112,010, a difference of 0.30%), Immigrants from Japan ($112,228, a difference of 0.49%), Immigrants from Belgium ($112,575, a difference of 0.80%), Immigrants from Asia ($110,787, a difference of 0.80%), and Asian ($112,666, a difference of 0.89%).
| Demographics | Rating | Rank | Householder Income Ages 25 - 44 years |
| Eastern Europeans | 100.0 /100 | #18 | Exceptional $114,523 |
| Burmese | 100.0 /100 | #19 | Exceptional $113,701 |
| Immigrants | Korea | 100.0 /100 | #20 | Exceptional $113,401 |
| Asians | 100.0 /100 | #21 | Exceptional $112,666 |
| Immigrants | Belgium | 100.0 /100 | #22 | Exceptional $112,575 |
| Immigrants | Japan | 100.0 /100 | #23 | Exceptional $112,228 |
| Immigrants | Sweden | 100.0 /100 | #24 | Exceptional $112,010 |
| Immigrants | Northern Europe | 100.0 /100 | #25 | Exceptional $111,676 |
| Immigrants | Asia | 100.0 /100 | #26 | Exceptional $110,787 |
| Russians | 100.0 /100 | #27 | Exceptional $110,398 |
| Immigrants | Denmark | 100.0 /100 | #28 | Exceptional $110,363 |
| Turks | 100.0 /100 | #29 | Exceptional $110,318 |
| Immigrants | Greece | 100.0 /100 | #30 | Exceptional $110,103 |
| Maltese | 100.0 /100 | #31 | Exceptional $110,064 |
| Immigrants | Sri Lanka | 100.0 /100 | #32 | Exceptional $109,741 |
Demographics Similar to Immigrants from Zaire by Householder Income Ages 25 - 44 years
In terms of householder income ages 25 - 44 years, the demographic groups most similar to Immigrants from Zaire are Chickasaw ($77,929, a difference of 0.15%), Choctaw ($78,168, a difference of 0.16%), Honduran ($78,540, a difference of 0.63%), Immigrants from Honduras ($77,328, a difference of 0.93%), and Immigrants from Mexico ($78,809, a difference of 0.98%).
| Demographics | Rating | Rank | Householder Income Ages 25 - 44 years |
| Cheyenne | 0.0 /100 | #314 | Tragic $79,152 |
| Ottawa | 0.0 /100 | #315 | Tragic $79,012 |
| Africans | 0.0 /100 | #316 | Tragic $78,986 |
| U.S. Virgin Islanders | 0.0 /100 | #317 | Tragic $78,911 |
| Immigrants | Mexico | 0.0 /100 | #318 | Tragic $78,809 |
| Hondurans | 0.0 /100 | #319 | Tragic $78,540 |
| Choctaw | 0.0 /100 | #320 | Tragic $78,168 |
| Immigrants | Zaire | 0.0 /100 | #321 | Tragic $78,045 |
| Chickasaw | 0.0 /100 | #322 | Tragic $77,929 |
| Immigrants | Honduras | 0.0 /100 | #323 | Tragic $77,328 |
| Dutch West Indians | 0.0 /100 | #324 | Tragic $77,260 |
| Sioux | 0.0 /100 | #325 | Tragic $77,089 |
| Houma | 0.0 /100 | #326 | Tragic $77,044 |
| Immigrants | Bahamas | 0.0 /100 | #327 | Tragic $76,910 |
| Immigrants | Cuba | 0.0 /100 | #328 | Tragic $76,701 |