Egyptian vs Immigrants from Zaire Householder Income Ages 25 - 44 years
COMPARE
Egyptian
Immigrants from Zaire
Householder Income Ages 25 - 44 years
Householder Income Ages 25 - 44 years Comparison
Egyptians
Immigrants from Zaire
$105,282
HOUSEHOLDER INCOME AGES 25 - 44 YEARS
99.7/ 100
METRIC RATING
60th/ 347
METRIC RANK
$78,045
HOUSEHOLDER INCOME AGES 25 - 44 YEARS
0.0/ 100
METRIC RATING
321st/ 347
METRIC RANK
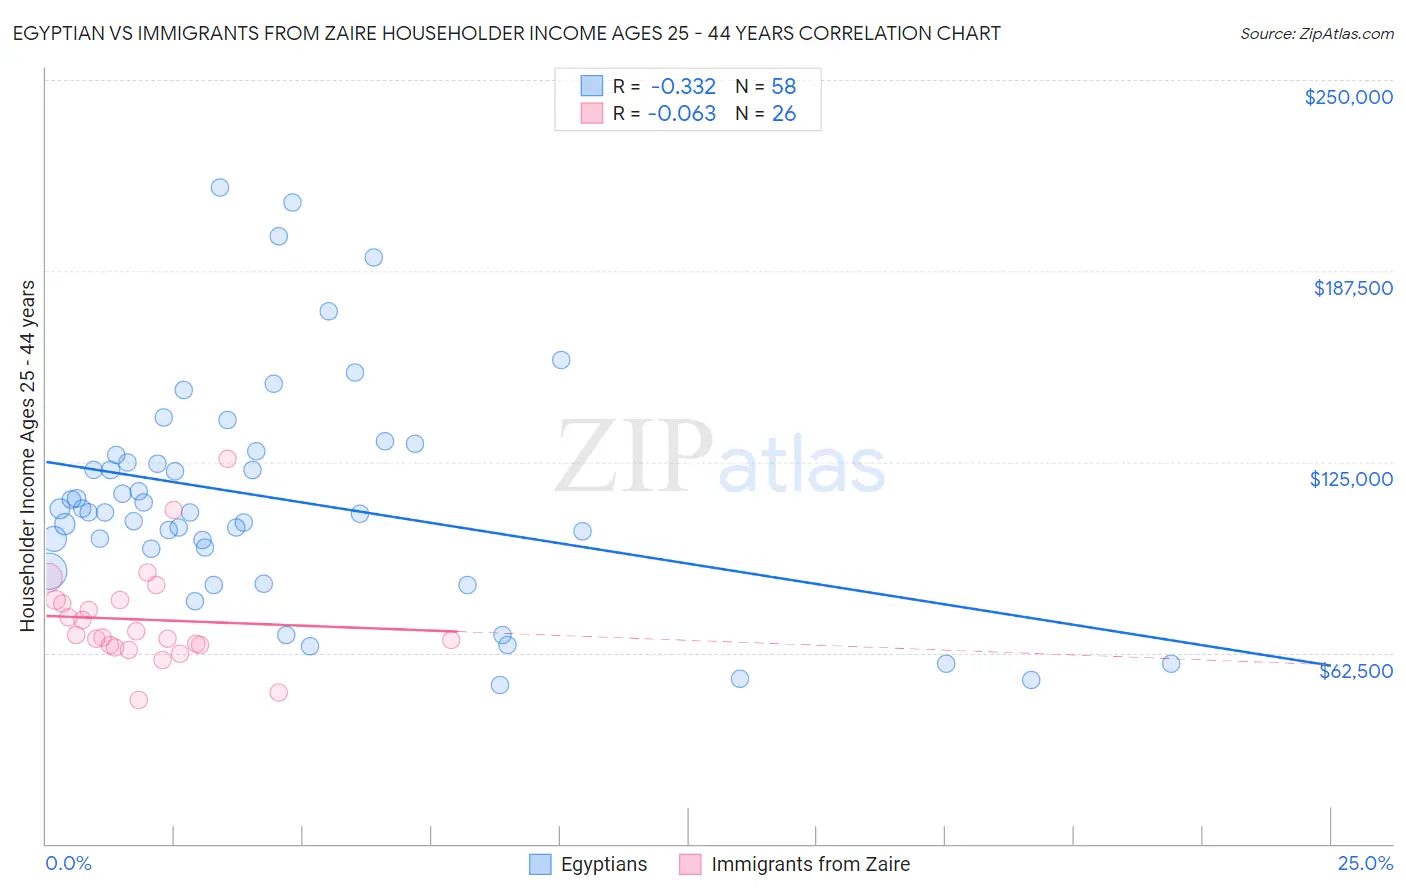
Egyptian vs Immigrants from Zaire Householder Income Ages 25 - 44 years Correlation Chart
The statistical analysis conducted on geographies consisting of 276,427,528 people shows a mild negative correlation between the proportion of Egyptians and household income with householder between the ages 25 and 44 in the United States with a correlation coefficient (R) of -0.332 and weighted average of $105,282. Similarly, the statistical analysis conducted on geographies consisting of 107,186,702 people shows a slight negative correlation between the proportion of Immigrants from Zaire and household income with householder between the ages 25 and 44 in the United States with a correlation coefficient (R) of -0.063 and weighted average of $78,045, a difference of 34.9%.
Householder Income Ages 25 - 44 years Correlation Summary
| Measurement | Egyptian | Immigrants from Zaire |
| Minimum | $52,083 | $46,875 |
| Maximum | $214,879 | $125,889 |
| Range | $162,796 | $79,014 |
| Mean | $112,843 | $73,350 |
| Median | $108,598 | $68,084 |
| Interquartile 25% (IQ1) | $96,583 | $64,948 |
| Interquartile 75% (IQ3) | $127,216 | $79,800 |
| Interquartile Range (IQR) | $30,633 | $14,852 |
| Standard Deviation (Sample) | $36,905 | $16,583 |
| Standard Deviation (Population) | $36,586 | $16,261 |
Similar Demographics by Householder Income Ages 25 - 44 years
Demographics Similar to Egyptians by Householder Income Ages 25 - 44 years
In terms of householder income ages 25 - 44 years, the demographic groups most similar to Egyptians are Lithuanian ($105,223, a difference of 0.060%), Immigrants from Italy ($105,201, a difference of 0.080%), Immigrants from Scotland ($105,089, a difference of 0.18%), New Zealander ($105,085, a difference of 0.19%), and Immigrants from Netherlands ($105,082, a difference of 0.19%).
| Demographics | Rating | Rank | Householder Income Ages 25 - 44 years |
| Immigrants | Norway | 99.9 /100 | #53 | Exceptional $106,629 |
| Paraguayans | 99.9 /100 | #54 | Exceptional $106,615 |
| Greeks | 99.9 /100 | #55 | Exceptional $106,457 |
| Immigrants | Pakistan | 99.8 /100 | #56 | Exceptional $106,129 |
| Immigrants | Austria | 99.8 /100 | #57 | Exceptional $106,103 |
| Immigrants | South Africa | 99.8 /100 | #58 | Exceptional $105,748 |
| Immigrants | Latvia | 99.8 /100 | #59 | Exceptional $105,522 |
| Egyptians | 99.7 /100 | #60 | Exceptional $105,282 |
| Lithuanians | 99.7 /100 | #61 | Exceptional $105,223 |
| Immigrants | Italy | 99.7 /100 | #62 | Exceptional $105,201 |
| Immigrants | Scotland | 99.7 /100 | #63 | Exceptional $105,089 |
| New Zealanders | 99.7 /100 | #64 | Exceptional $105,085 |
| Immigrants | Netherlands | 99.7 /100 | #65 | Exceptional $105,082 |
| Laotians | 99.7 /100 | #66 | Exceptional $104,993 |
| Immigrants | Romania | 99.6 /100 | #67 | Exceptional $104,713 |
Demographics Similar to Immigrants from Zaire by Householder Income Ages 25 - 44 years
In terms of householder income ages 25 - 44 years, the demographic groups most similar to Immigrants from Zaire are Chickasaw ($77,929, a difference of 0.15%), Choctaw ($78,168, a difference of 0.16%), Honduran ($78,540, a difference of 0.63%), Immigrants from Honduras ($77,328, a difference of 0.93%), and Immigrants from Mexico ($78,809, a difference of 0.98%).
| Demographics | Rating | Rank | Householder Income Ages 25 - 44 years |
| Cheyenne | 0.0 /100 | #314 | Tragic $79,152 |
| Ottawa | 0.0 /100 | #315 | Tragic $79,012 |
| Africans | 0.0 /100 | #316 | Tragic $78,986 |
| U.S. Virgin Islanders | 0.0 /100 | #317 | Tragic $78,911 |
| Immigrants | Mexico | 0.0 /100 | #318 | Tragic $78,809 |
| Hondurans | 0.0 /100 | #319 | Tragic $78,540 |
| Choctaw | 0.0 /100 | #320 | Tragic $78,168 |
| Immigrants | Zaire | 0.0 /100 | #321 | Tragic $78,045 |
| Chickasaw | 0.0 /100 | #322 | Tragic $77,929 |
| Immigrants | Honduras | 0.0 /100 | #323 | Tragic $77,328 |
| Dutch West Indians | 0.0 /100 | #324 | Tragic $77,260 |
| Sioux | 0.0 /100 | #325 | Tragic $77,089 |
| Houma | 0.0 /100 | #326 | Tragic $77,044 |
| Immigrants | Bahamas | 0.0 /100 | #327 | Tragic $76,910 |
| Immigrants | Cuba | 0.0 /100 | #328 | Tragic $76,701 |