Immigrants from Northern Africa vs French Median Household Income
COMPARE
Immigrants from Northern Africa
French
Median Household Income
Median Household Income Comparison
Immigrants from Northern Africa
French
$90,026
MEDIAN HOUSEHOLD INCOME
95.9/ 100
METRIC RATING
114th/ 347
METRIC RANK
$83,468
MEDIAN HOUSEHOLD INCOME
26.0/ 100
METRIC RATING
196th/ 347
METRIC RANK
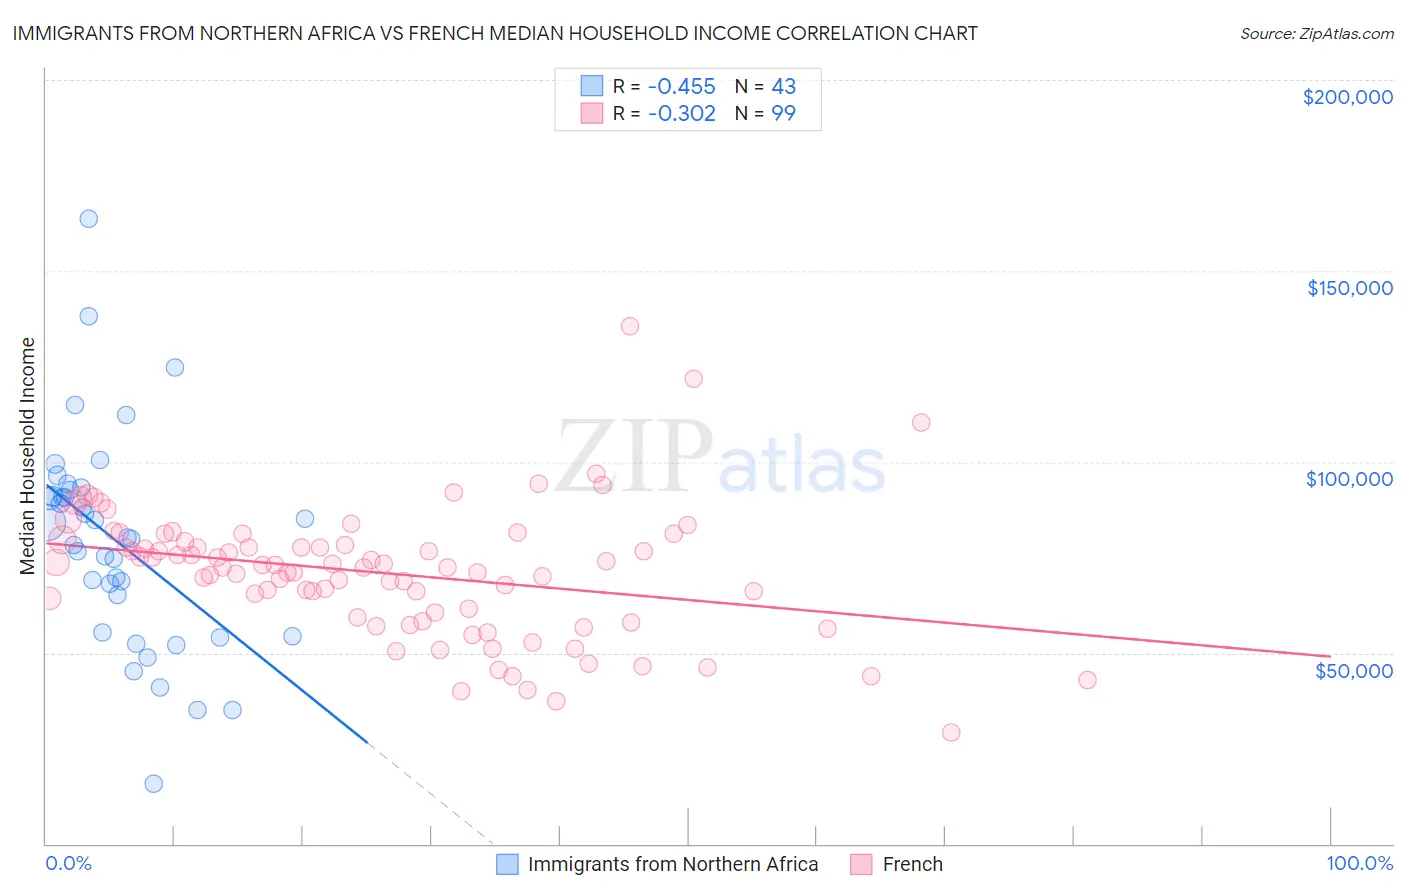
Immigrants from Northern Africa vs French Median Household Income Correlation Chart
The statistical analysis conducted on geographies consisting of 321,059,386 people shows a moderate negative correlation between the proportion of Immigrants from Northern Africa and median household income in the United States with a correlation coefficient (R) of -0.455 and weighted average of $90,026. Similarly, the statistical analysis conducted on geographies consisting of 571,286,063 people shows a mild negative correlation between the proportion of French and median household income in the United States with a correlation coefficient (R) of -0.302 and weighted average of $83,468, a difference of 7.9%.
Median Household Income Correlation Summary
| Measurement | Immigrants from Northern Africa | French |
| Minimum | $15,682 | $29,263 |
| Maximum | $163,611 | $135,625 |
| Range | $147,929 | $106,362 |
| Mean | $79,183 | $70,877 |
| Median | $80,044 | $72,372 |
| Interquartile 25% (IQ1) | $55,170 | $59,090 |
| Interquartile 75% (IQ3) | $92,628 | $79,064 |
| Interquartile Range (IQR) | $37,458 | $19,974 |
| Standard Deviation (Sample) | $28,084 | $17,004 |
| Standard Deviation (Population) | $27,755 | $16,918 |
Similar Demographics by Median Household Income
Demographics Similar to Immigrants from Northern Africa by Median Household Income
In terms of median household income, the demographic groups most similar to Immigrants from Northern Africa are Immigrants from Western Asia ($90,005, a difference of 0.020%), Native Hawaiian ($89,919, a difference of 0.12%), Taiwanese ($89,900, a difference of 0.14%), Syrian ($89,830, a difference of 0.22%), and Peruvian ($90,261, a difference of 0.26%).
| Demographics | Rating | Rank | Median Household Income |
| Croatians | 97.3 /100 | #107 | Exceptional $90,685 |
| Zimbabweans | 97.2 /100 | #108 | Exceptional $90,618 |
| Chileans | 97.2 /100 | #109 | Exceptional $90,605 |
| Palestinians | 97.1 /100 | #110 | Exceptional $90,574 |
| Immigrants | Poland | 97.1 /100 | #111 | Exceptional $90,549 |
| Northern Europeans | 96.9 /100 | #112 | Exceptional $90,446 |
| Peruvians | 96.5 /100 | #113 | Exceptional $90,261 |
| Immigrants | Northern Africa | 95.9 /100 | #114 | Exceptional $90,026 |
| Immigrants | Western Asia | 95.9 /100 | #115 | Exceptional $90,005 |
| Native Hawaiians | 95.7 /100 | #116 | Exceptional $89,919 |
| Taiwanese | 95.6 /100 | #117 | Exceptional $89,900 |
| Syrians | 95.4 /100 | #118 | Exceptional $89,830 |
| Albanians | 95.2 /100 | #119 | Exceptional $89,744 |
| Immigrants | North Macedonia | 95.2 /100 | #120 | Exceptional $89,741 |
| Ethiopians | 94.9 /100 | #121 | Exceptional $89,640 |
Demographics Similar to French by Median Household Income
In terms of median household income, the demographic groups most similar to French are Aleut ($83,446, a difference of 0.030%), Japanese ($83,395, a difference of 0.090%), Immigrants from Armenia ($83,555, a difference of 0.10%), German ($83,358, a difference of 0.13%), and Ghanaian ($83,582, a difference of 0.14%).
| Demographics | Rating | Rank | Median Household Income |
| Immigrants | Colombia | 31.7 /100 | #189 | Fair $83,902 |
| Slovaks | 30.2 /100 | #190 | Fair $83,798 |
| Iraqis | 29.6 /100 | #191 | Fair $83,753 |
| Welsh | 28.0 /100 | #192 | Fair $83,628 |
| Finns | 27.7 /100 | #193 | Fair $83,607 |
| Ghanaians | 27.4 /100 | #194 | Fair $83,582 |
| Immigrants | Armenia | 27.0 /100 | #195 | Fair $83,555 |
| French | 26.0 /100 | #196 | Fair $83,468 |
| Aleuts | 25.7 /100 | #197 | Fair $83,446 |
| Japanese | 25.1 /100 | #198 | Fair $83,395 |
| Germans | 24.6 /100 | #199 | Fair $83,358 |
| Tsimshian | 24.5 /100 | #200 | Fair $83,346 |
| Spanish | 24.4 /100 | #201 | Fair $83,343 |
| Immigrants | Thailand | 24.3 /100 | #202 | Fair $83,327 |
| Immigrants | Cambodia | 24.0 /100 | #203 | Fair $83,304 |