Immigrants from Northern Africa vs Luxembourger Per Capita Income
COMPARE
Immigrants from Northern Africa
Luxembourger
Per Capita Income
Per Capita Income Comparison
Immigrants from Northern Africa
Luxembourgers
$46,531
PER CAPITA INCOME
96.2/ 100
METRIC RATING
109th/ 347
METRIC RANK
$45,663
PER CAPITA INCOME
90.4/ 100
METRIC RATING
129th/ 347
METRIC RANK
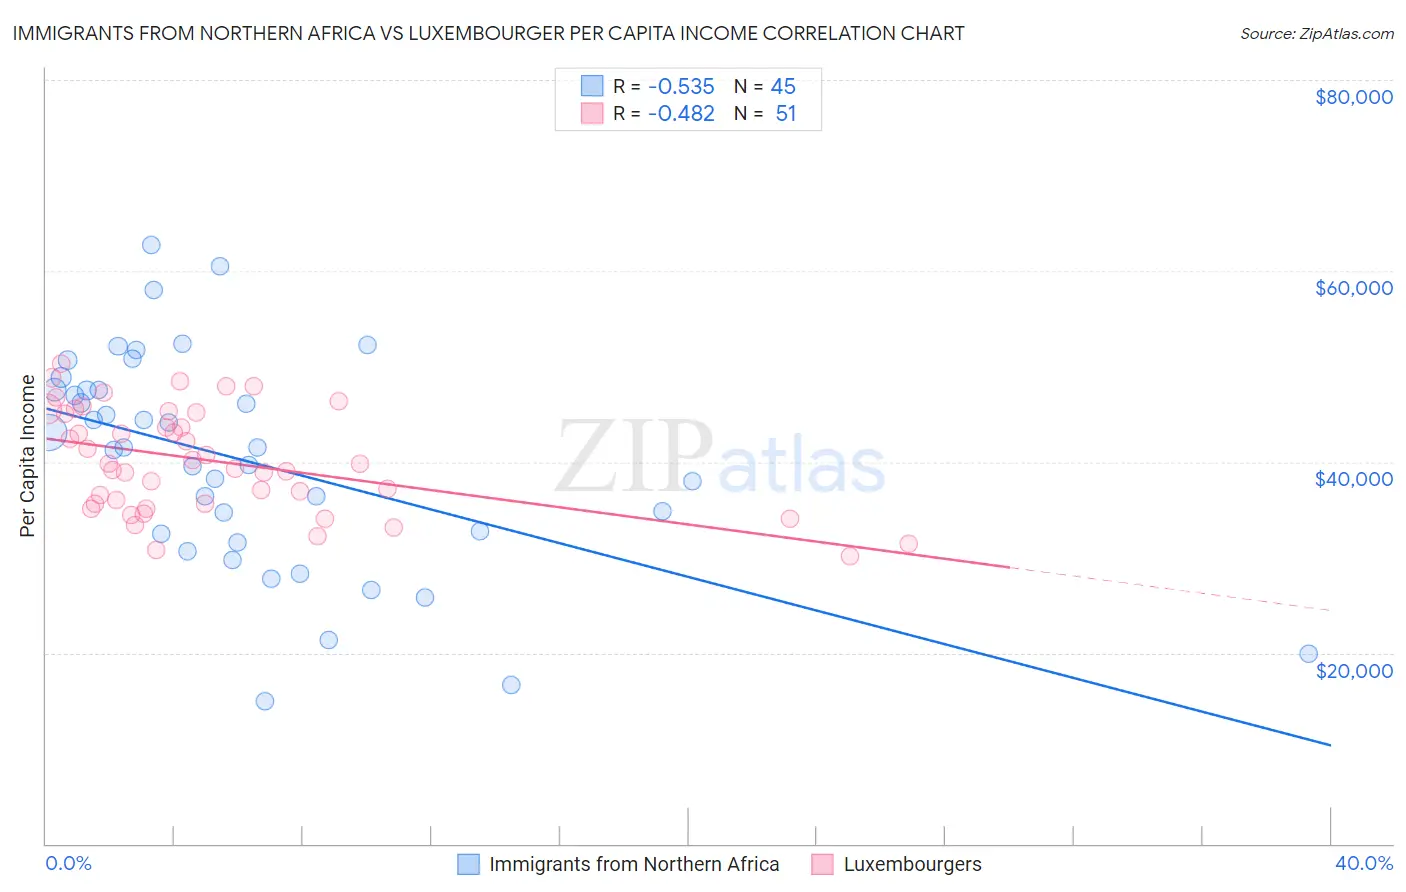
Immigrants from Northern Africa vs Luxembourger Per Capita Income Correlation Chart
The statistical analysis conducted on geographies consisting of 321,207,992 people shows a substantial negative correlation between the proportion of Immigrants from Northern Africa and per capita income in the United States with a correlation coefficient (R) of -0.535 and weighted average of $46,531. Similarly, the statistical analysis conducted on geographies consisting of 144,682,505 people shows a moderate negative correlation between the proportion of Luxembourgers and per capita income in the United States with a correlation coefficient (R) of -0.482 and weighted average of $45,663, a difference of 1.9%.
Per Capita Income Correlation Summary
| Measurement | Immigrants from Northern Africa | Luxembourger |
| Minimum | $14,939 | $30,080 |
| Maximum | $62,708 | $50,248 |
| Range | $47,769 | $20,168 |
| Mean | $40,067 | $40,097 |
| Median | $41,480 | $39,752 |
| Interquartile 25% (IQ1) | $32,060 | $35,555 |
| Interquartile 75% (IQ3) | $47,546 | $45,199 |
| Interquartile Range (IQR) | $15,486 | $9,644 |
| Standard Deviation (Sample) | $11,278 | $5,390 |
| Standard Deviation (Population) | $11,152 | $5,337 |
Demographics Similar to Immigrants from Northern Africa and Luxembourgers by Per Capita Income
In terms of per capita income, the demographic groups most similar to Immigrants from Northern Africa are Chilean ($46,459, a difference of 0.15%), Taiwanese ($46,455, a difference of 0.16%), Immigrants from Morocco ($46,430, a difference of 0.22%), Immigrants from Albania ($46,387, a difference of 0.31%), and Afghan ($46,268, a difference of 0.57%). Similarly, the demographic groups most similar to Luxembourgers are Immigrants from Germany ($45,751, a difference of 0.19%), Swedish ($45,750, a difference of 0.19%), Palestinian ($45,790, a difference of 0.28%), Zimbabwean ($45,804, a difference of 0.31%), and European ($45,836, a difference of 0.38%).
| Demographics | Rating | Rank | Per Capita Income |
| Immigrants | Northern Africa | 96.2 /100 | #109 | Exceptional $46,531 |
| Chileans | 95.9 /100 | #110 | Exceptional $46,459 |
| Taiwanese | 95.8 /100 | #111 | Exceptional $46,455 |
| Immigrants | Morocco | 95.7 /100 | #112 | Exceptional $46,430 |
| Immigrants | Albania | 95.5 /100 | #113 | Exceptional $46,387 |
| Afghans | 94.9 /100 | #114 | Exceptional $46,268 |
| Immigrants | Chile | 94.6 /100 | #115 | Exceptional $46,213 |
| Poles | 94.1 /100 | #116 | Exceptional $46,123 |
| Chinese | 93.9 /100 | #117 | Exceptional $46,098 |
| Immigrants | Saudi Arabia | 93.3 /100 | #118 | Exceptional $46,008 |
| Immigrants | Poland | 93.1 /100 | #119 | Exceptional $45,979 |
| Immigrants | Ethiopia | 92.7 /100 | #120 | Exceptional $45,923 |
| Canadians | 92.2 /100 | #121 | Exceptional $45,858 |
| Moroccans | 92.1 /100 | #122 | Exceptional $45,854 |
| Lebanese | 92.0 /100 | #123 | Exceptional $45,840 |
| Europeans | 92.0 /100 | #124 | Exceptional $45,836 |
| Zimbabweans | 91.7 /100 | #125 | Exceptional $45,804 |
| Palestinians | 91.6 /100 | #126 | Exceptional $45,790 |
| Immigrants | Germany | 91.3 /100 | #127 | Exceptional $45,751 |
| Swedes | 91.3 /100 | #128 | Exceptional $45,750 |
| Luxembourgers | 90.4 /100 | #129 | Exceptional $45,663 |