Immigrants from Northern Africa vs Luxembourger Cognitive Disability
COMPARE
Immigrants from Northern Africa
Luxembourger
Cognitive Disability
Cognitive Disability Comparison
Immigrants from Northern Africa
Luxembourgers
17.3%
COGNITIVE DISABILITY
50.2/ 100
METRIC RATING
173rd/ 347
METRIC RANK
16.4%
COGNITIVE DISABILITY
99.9/ 100
METRIC RATING
25th/ 347
METRIC RANK
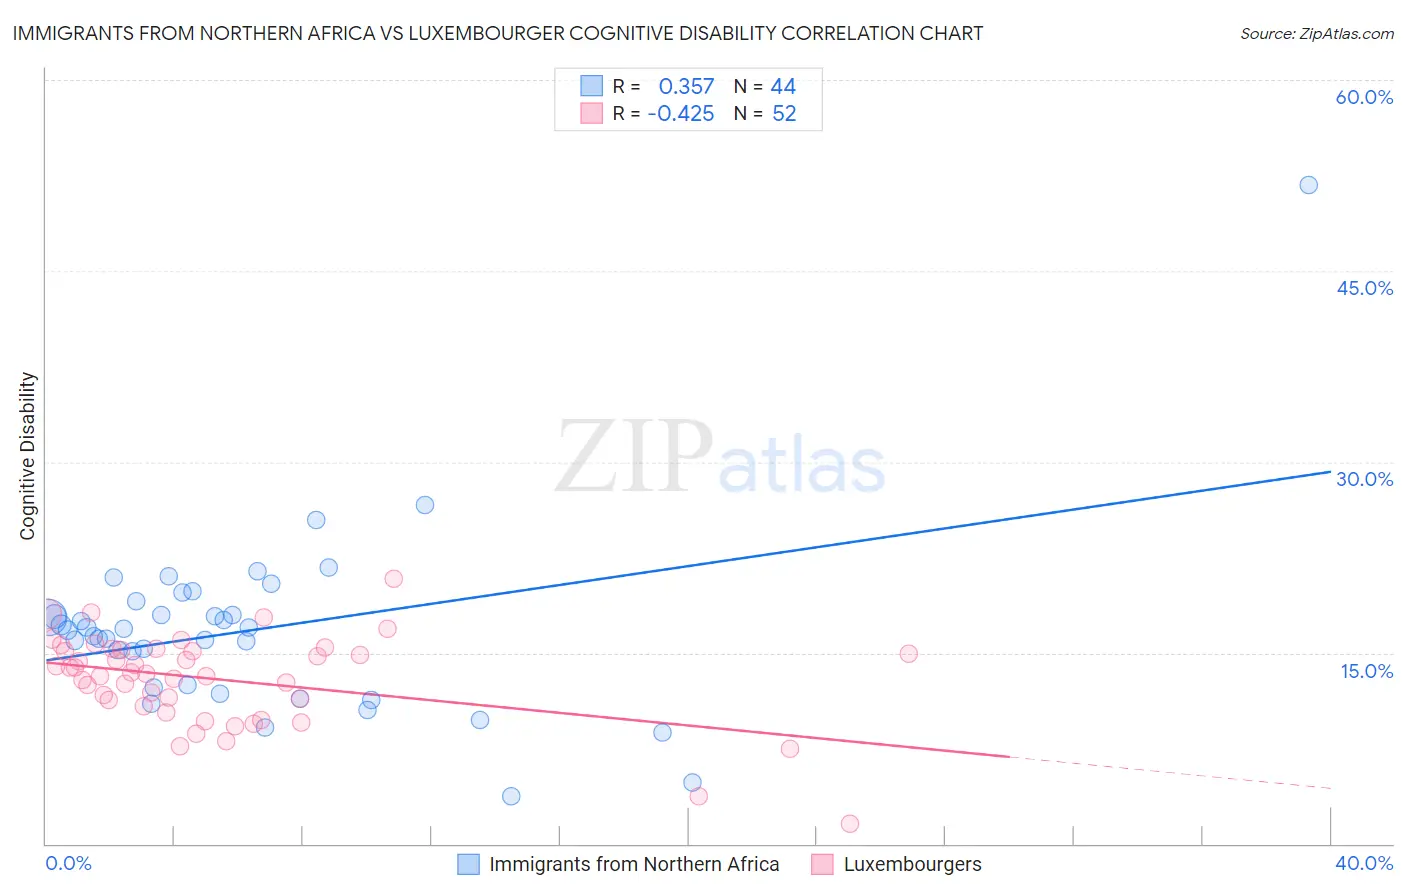
Immigrants from Northern Africa vs Luxembourger Cognitive Disability Correlation Chart
The statistical analysis conducted on geographies consisting of 321,181,244 people shows a mild positive correlation between the proportion of Immigrants from Northern Africa and percentage of population with cognitive disability in the United States with a correlation coefficient (R) of 0.357 and weighted average of 17.3%. Similarly, the statistical analysis conducted on geographies consisting of 144,680,571 people shows a moderate negative correlation between the proportion of Luxembourgers and percentage of population with cognitive disability in the United States with a correlation coefficient (R) of -0.425 and weighted average of 16.4%, a difference of 5.5%.
Cognitive Disability Correlation Summary
| Measurement | Immigrants from Northern Africa | Luxembourger |
| Minimum | 3.7% | 1.6% |
| Maximum | 51.8% | 20.8% |
| Range | 48.1% | 19.3% |
| Mean | 16.7% | 12.9% |
| Median | 16.8% | 13.4% |
| Interquartile 25% (IQ1) | 12.4% | 11.0% |
| Interquartile 75% (IQ3) | 18.5% | 15.2% |
| Interquartile Range (IQR) | 6.2% | 4.2% |
| Standard Deviation (Sample) | 7.2% | 3.5% |
| Standard Deviation (Population) | 7.1% | 3.5% |
Similar Demographics by Cognitive Disability
Demographics Similar to Immigrants from Northern Africa by Cognitive Disability
In terms of cognitive disability, the demographic groups most similar to Immigrants from Northern Africa are Laotian (17.3%, a difference of 0.010%), Tsimshian (17.3%, a difference of 0.010%), Shoshone (17.3%, a difference of 0.030%), Ute (17.3%, a difference of 0.030%), and Spanish (17.3%, a difference of 0.040%).
| Demographics | Rating | Rank | Cognitive Disability |
| Immigrants | Ecuador | 64.4 /100 | #166 | Good 17.2% |
| Immigrants | Syria | 63.5 /100 | #167 | Good 17.2% |
| Immigrants | Immigrants | 62.5 /100 | #168 | Good 17.2% |
| Immigrants | Portugal | 61.8 /100 | #169 | Good 17.2% |
| Ecuadorians | 59.6 /100 | #170 | Average 17.2% |
| Tlingit-Haida | 59.4 /100 | #171 | Average 17.2% |
| Immigrants | Turkey | 56.7 /100 | #172 | Average 17.2% |
| Immigrants | Northern Africa | 50.2 /100 | #173 | Average 17.3% |
| Laotians | 50.0 /100 | #174 | Average 17.3% |
| Tsimshian | 49.8 /100 | #175 | Average 17.3% |
| Shoshone | 49.2 /100 | #176 | Average 17.3% |
| Ute | 49.1 /100 | #177 | Average 17.3% |
| Spanish | 48.9 /100 | #178 | Average 17.3% |
| Sioux | 48.6 /100 | #179 | Average 17.3% |
| Pakistanis | 43.9 /100 | #180 | Average 17.3% |
Demographics Similar to Luxembourgers by Cognitive Disability
In terms of cognitive disability, the demographic groups most similar to Luxembourgers are Immigrants from Croatia (16.4%, a difference of 0.030%), Immigrants from Argentina (16.4%, a difference of 0.040%), Immigrants from Pakistan (16.4%, a difference of 0.050%), Polish (16.4%, a difference of 0.050%), and Croatian (16.4%, a difference of 0.060%).
| Demographics | Rating | Rank | Cognitive Disability |
| Immigrants | Northern Europe | 100.0 /100 | #18 | Exceptional 16.3% |
| Immigrants | Bolivia | 100.0 /100 | #19 | Exceptional 16.3% |
| Bulgarians | 100.0 /100 | #20 | Exceptional 16.3% |
| Immigrants | Cuba | 100.0 /100 | #21 | Exceptional 16.3% |
| Immigrants | South Central Asia | 99.9 /100 | #22 | Exceptional 16.4% |
| Croatians | 99.9 /100 | #23 | Exceptional 16.4% |
| Immigrants | Argentina | 99.9 /100 | #24 | Exceptional 16.4% |
| Luxembourgers | 99.9 /100 | #25 | Exceptional 16.4% |
| Immigrants | Croatia | 99.9 /100 | #26 | Exceptional 16.4% |
| Immigrants | Pakistan | 99.9 /100 | #27 | Exceptional 16.4% |
| Poles | 99.9 /100 | #28 | Exceptional 16.4% |
| Filipinos | 99.9 /100 | #29 | Exceptional 16.4% |
| Czechs | 99.9 /100 | #30 | Exceptional 16.4% |
| Immigrants | Romania | 99.9 /100 | #31 | Exceptional 16.4% |
| Immigrants | Israel | 99.9 /100 | #32 | Exceptional 16.4% |