Jordanian vs Luxembourger Per Capita Income
COMPARE
Jordanian
Luxembourger
Per Capita Income
Per Capita Income Comparison
Jordanians
Luxembourgers
$45,605
PER CAPITA INCOME
89.9/ 100
METRIC RATING
132nd/ 347
METRIC RANK
$45,663
PER CAPITA INCOME
90.4/ 100
METRIC RATING
129th/ 347
METRIC RANK
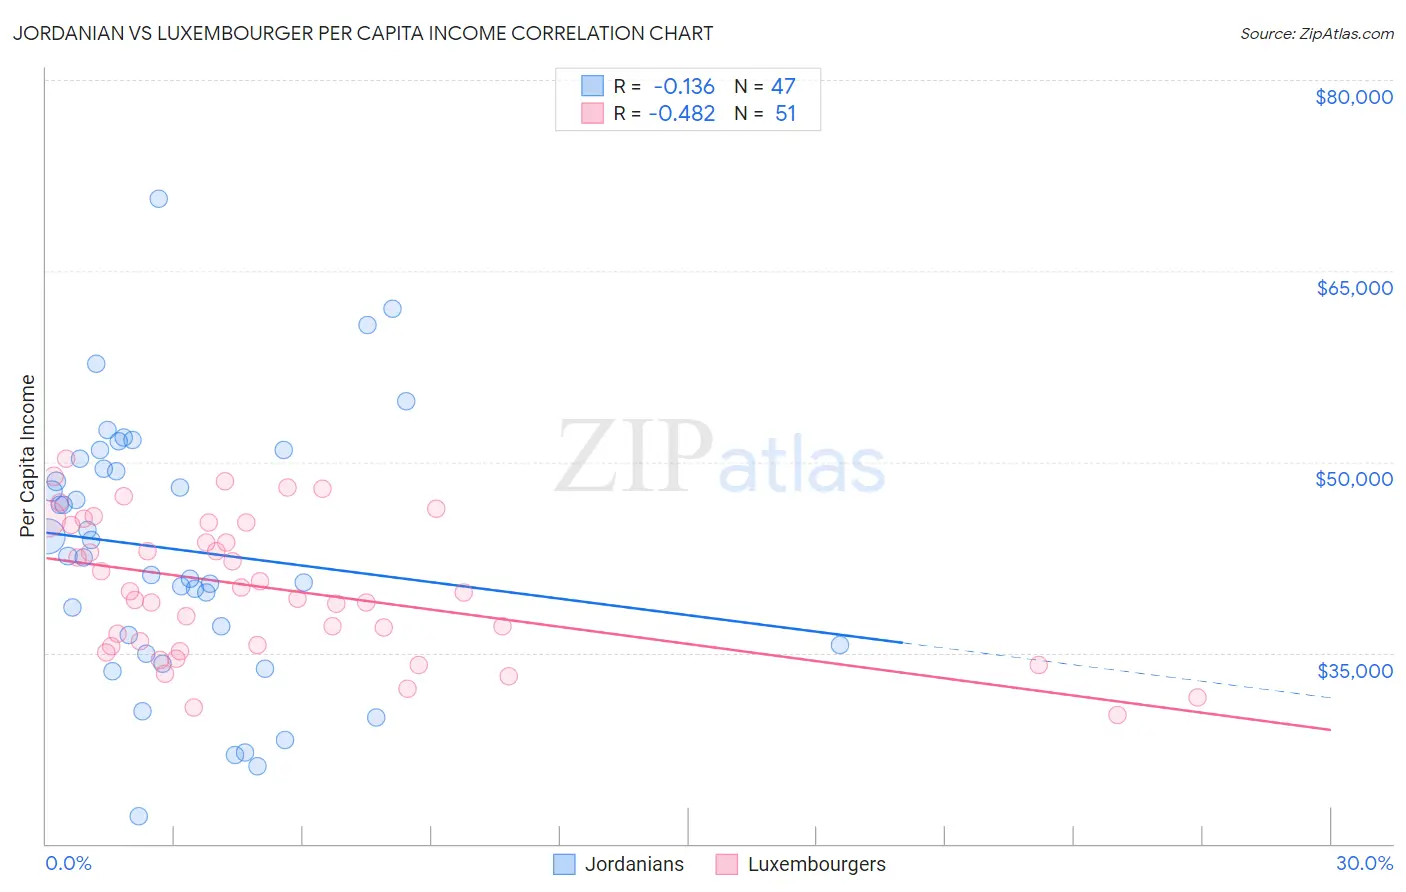
Jordanian vs Luxembourger Per Capita Income Correlation Chart
The statistical analysis conducted on geographies consisting of 166,389,755 people shows a poor negative correlation between the proportion of Jordanians and per capita income in the United States with a correlation coefficient (R) of -0.136 and weighted average of $45,605. Similarly, the statistical analysis conducted on geographies consisting of 144,682,505 people shows a moderate negative correlation between the proportion of Luxembourgers and per capita income in the United States with a correlation coefficient (R) of -0.482 and weighted average of $45,663, a difference of 0.13%.
Per Capita Income Correlation Summary
| Measurement | Jordanian | Luxembourger |
| Minimum | $22,143 | $30,080 |
| Maximum | $70,697 | $50,248 |
| Range | $48,554 | $20,168 |
| Mean | $43,077 | $40,097 |
| Median | $42,576 | $39,752 |
| Interquartile 25% (IQ1) | $35,594 | $35,555 |
| Interquartile 75% (IQ3) | $50,277 | $45,199 |
| Interquartile Range (IQR) | $14,683 | $9,644 |
| Standard Deviation (Sample) | $10,214 | $5,390 |
| Standard Deviation (Population) | $10,105 | $5,337 |
Demographics Similar to Jordanians and Luxembourgers by Per Capita Income
In terms of per capita income, the demographic groups most similar to Jordanians are Immigrants from North Macedonia ($45,622, a difference of 0.040%), Pakistani ($45,587, a difference of 0.040%), Slovene ($45,581, a difference of 0.050%), Arab ($45,662, a difference of 0.12%), and Immigrants from Germany ($45,751, a difference of 0.32%). Similarly, the demographic groups most similar to Luxembourgers are Arab ($45,662, a difference of 0.0%), Immigrants from North Macedonia ($45,622, a difference of 0.090%), Pakistani ($45,587, a difference of 0.17%), Slovene ($45,581, a difference of 0.18%), and Immigrants from Germany ($45,751, a difference of 0.19%).
| Demographics | Rating | Rank | Per Capita Income |
| Immigrants | Ethiopia | 92.7 /100 | #120 | Exceptional $45,923 |
| Canadians | 92.2 /100 | #121 | Exceptional $45,858 |
| Moroccans | 92.1 /100 | #122 | Exceptional $45,854 |
| Lebanese | 92.0 /100 | #123 | Exceptional $45,840 |
| Europeans | 92.0 /100 | #124 | Exceptional $45,836 |
| Zimbabweans | 91.7 /100 | #125 | Exceptional $45,804 |
| Palestinians | 91.6 /100 | #126 | Exceptional $45,790 |
| Immigrants | Germany | 91.3 /100 | #127 | Exceptional $45,751 |
| Swedes | 91.3 /100 | #128 | Exceptional $45,750 |
| Luxembourgers | 90.4 /100 | #129 | Exceptional $45,663 |
| Arabs | 90.4 /100 | #130 | Exceptional $45,662 |
| Immigrants | North Macedonia | 90.0 /100 | #131 | Exceptional $45,622 |
| Jordanians | 89.9 /100 | #132 | Excellent $45,605 |
| Pakistanis | 89.7 /100 | #133 | Excellent $45,587 |
| Slovenes | 89.6 /100 | #134 | Excellent $45,581 |
| Hungarians | 87.9 /100 | #135 | Excellent $45,426 |
| Immigrants | Oceania | 85.2 /100 | #136 | Excellent $45,220 |
| Immigrants | Syria | 85.2 /100 | #137 | Excellent $45,218 |
| Assyrians/Chaldeans/Syriacs | 84.8 /100 | #138 | Excellent $45,195 |
| Basques | 83.2 /100 | #139 | Excellent $45,086 |
| Immigrants | Jordan | 82.9 /100 | #140 | Excellent $45,066 |