Immigrants from Northern Africa vs Guatemalan Per Capita Income
COMPARE
Immigrants from Northern Africa
Guatemalan
Per Capita Income
Per Capita Income Comparison
Immigrants from Northern Africa
Guatemalans
$46,531
PER CAPITA INCOME
96.2/ 100
METRIC RATING
109th/ 347
METRIC RANK
$37,766
PER CAPITA INCOME
0.1/ 100
METRIC RATING
285th/ 347
METRIC RANK
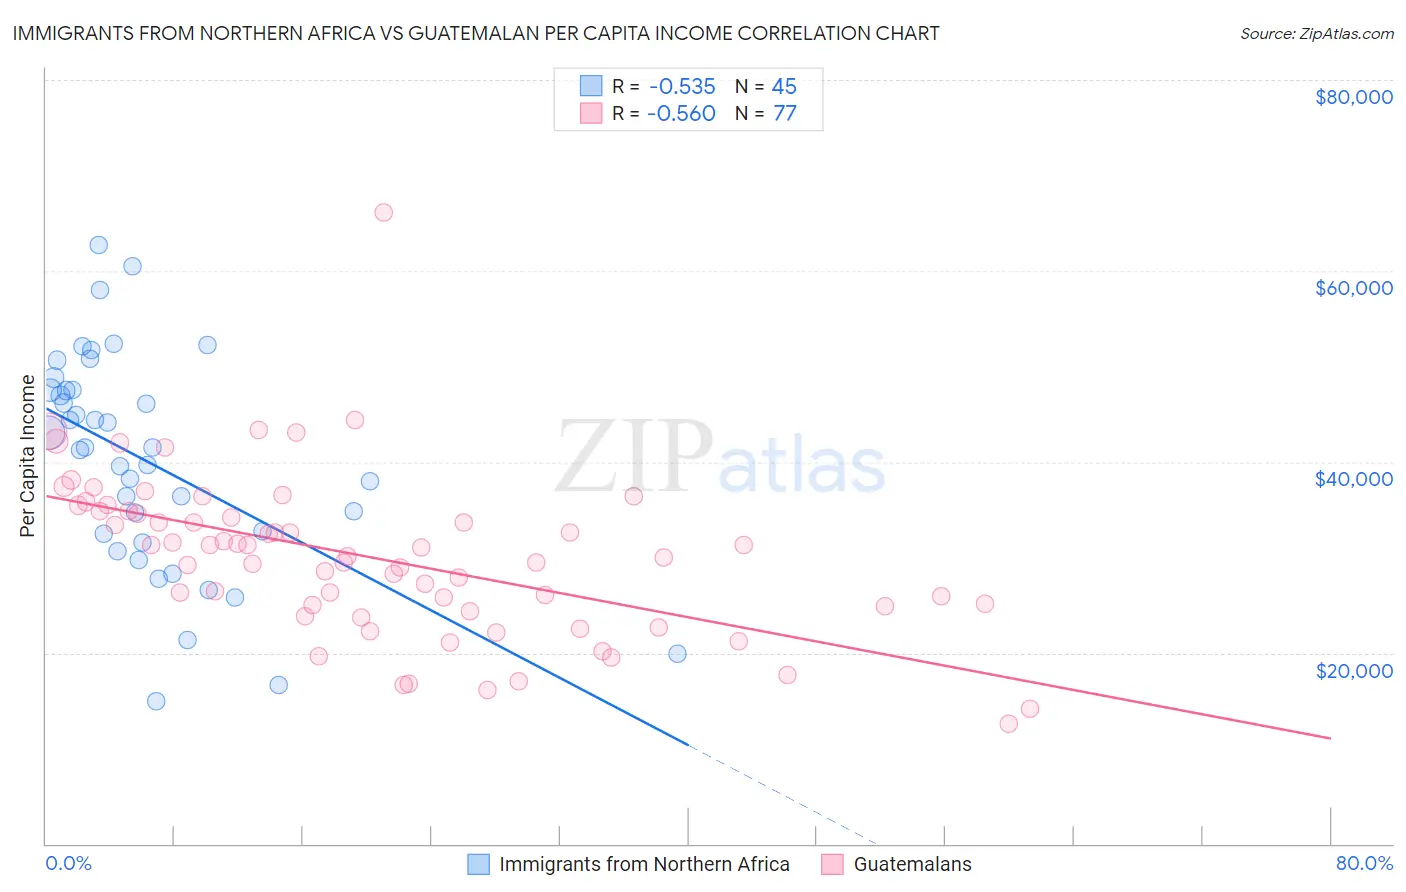
Immigrants from Northern Africa vs Guatemalan Per Capita Income Correlation Chart
The statistical analysis conducted on geographies consisting of 321,207,992 people shows a substantial negative correlation between the proportion of Immigrants from Northern Africa and per capita income in the United States with a correlation coefficient (R) of -0.535 and weighted average of $46,531. Similarly, the statistical analysis conducted on geographies consisting of 409,586,498 people shows a substantial negative correlation between the proportion of Guatemalans and per capita income in the United States with a correlation coefficient (R) of -0.560 and weighted average of $37,766, a difference of 23.2%.
Per Capita Income Correlation Summary
| Measurement | Immigrants from Northern Africa | Guatemalan |
| Minimum | $14,939 | $12,606 |
| Maximum | $62,708 | $66,145 |
| Range | $47,769 | $53,539 |
| Mean | $40,067 | $29,994 |
| Median | $41,480 | $30,165 |
| Interquartile 25% (IQ1) | $32,060 | $24,578 |
| Interquartile 75% (IQ3) | $47,546 | $34,822 |
| Interquartile Range (IQR) | $15,486 | $10,244 |
| Standard Deviation (Sample) | $11,278 | $8,508 |
| Standard Deviation (Population) | $11,152 | $8,452 |
Similar Demographics by Per Capita Income
Demographics Similar to Immigrants from Northern Africa by Per Capita Income
In terms of per capita income, the demographic groups most similar to Immigrants from Northern Africa are Immigrants from Kuwait ($46,543, a difference of 0.030%), Serbian ($46,551, a difference of 0.040%), Ethiopian ($46,569, a difference of 0.080%), British ($46,571, a difference of 0.090%), and Chilean ($46,459, a difference of 0.15%).
| Demographics | Rating | Rank | Per Capita Income |
| Immigrants | Western Asia | 97.4 /100 | #102 | Exceptional $46,876 |
| Syrians | 97.2 /100 | #103 | Exceptional $46,837 |
| Brazilians | 96.8 /100 | #104 | Exceptional $46,700 |
| British | 96.3 /100 | #105 | Exceptional $46,571 |
| Ethiopians | 96.3 /100 | #106 | Exceptional $46,569 |
| Serbians | 96.2 /100 | #107 | Exceptional $46,551 |
| Immigrants | Kuwait | 96.2 /100 | #108 | Exceptional $46,543 |
| Immigrants | Northern Africa | 96.2 /100 | #109 | Exceptional $46,531 |
| Chileans | 95.9 /100 | #110 | Exceptional $46,459 |
| Taiwanese | 95.8 /100 | #111 | Exceptional $46,455 |
| Immigrants | Morocco | 95.7 /100 | #112 | Exceptional $46,430 |
| Immigrants | Albania | 95.5 /100 | #113 | Exceptional $46,387 |
| Afghans | 94.9 /100 | #114 | Exceptional $46,268 |
| Immigrants | Chile | 94.6 /100 | #115 | Exceptional $46,213 |
| Poles | 94.1 /100 | #116 | Exceptional $46,123 |
Demographics Similar to Guatemalans by Per Capita Income
In terms of per capita income, the demographic groups most similar to Guatemalans are African ($37,785, a difference of 0.050%), Central American Indian ($37,699, a difference of 0.18%), Dominican ($37,697, a difference of 0.19%), Blackfeet ($37,695, a difference of 0.19%), and Pennsylvania German ($37,842, a difference of 0.20%).
| Demographics | Rating | Rank | Per Capita Income |
| Immigrants | Nicaragua | 0.2 /100 | #278 | Tragic $38,065 |
| Colville | 0.2 /100 | #279 | Tragic $38,047 |
| Potawatomi | 0.2 /100 | #280 | Tragic $38,046 |
| Immigrants | Dominica | 0.2 /100 | #281 | Tragic $37,952 |
| Immigrants | Laos | 0.1 /100 | #282 | Tragic $37,857 |
| Pennsylvania Germans | 0.1 /100 | #283 | Tragic $37,842 |
| Africans | 0.1 /100 | #284 | Tragic $37,785 |
| Guatemalans | 0.1 /100 | #285 | Tragic $37,766 |
| Central American Indians | 0.1 /100 | #286 | Tragic $37,699 |
| Dominicans | 0.1 /100 | #287 | Tragic $37,697 |
| Blackfeet | 0.1 /100 | #288 | Tragic $37,695 |
| U.S. Virgin Islanders | 0.1 /100 | #289 | Tragic $37,589 |
| Immigrants | Guatemala | 0.1 /100 | #290 | Tragic $37,550 |
| Cajuns | 0.1 /100 | #291 | Tragic $37,527 |
| Immigrants | Micronesia | 0.1 /100 | #292 | Tragic $37,464 |