Immigrants from North Macedonia vs Immigrants from Ethiopia Householder Income Over 65 years
COMPARE
Immigrants from North Macedonia
Immigrants from Ethiopia
Householder Income Over 65 years
Householder Income Over 65 years Comparison
Immigrants from North Macedonia
Immigrants from Ethiopia
$61,175
HOUSEHOLDER INCOME OVER 65 YEARS
55.4/ 100
METRIC RATING
164th/ 347
METRIC RANK
$65,238
HOUSEHOLDER INCOME OVER 65 YEARS
98.9/ 100
METRIC RATING
73rd/ 347
METRIC RANK
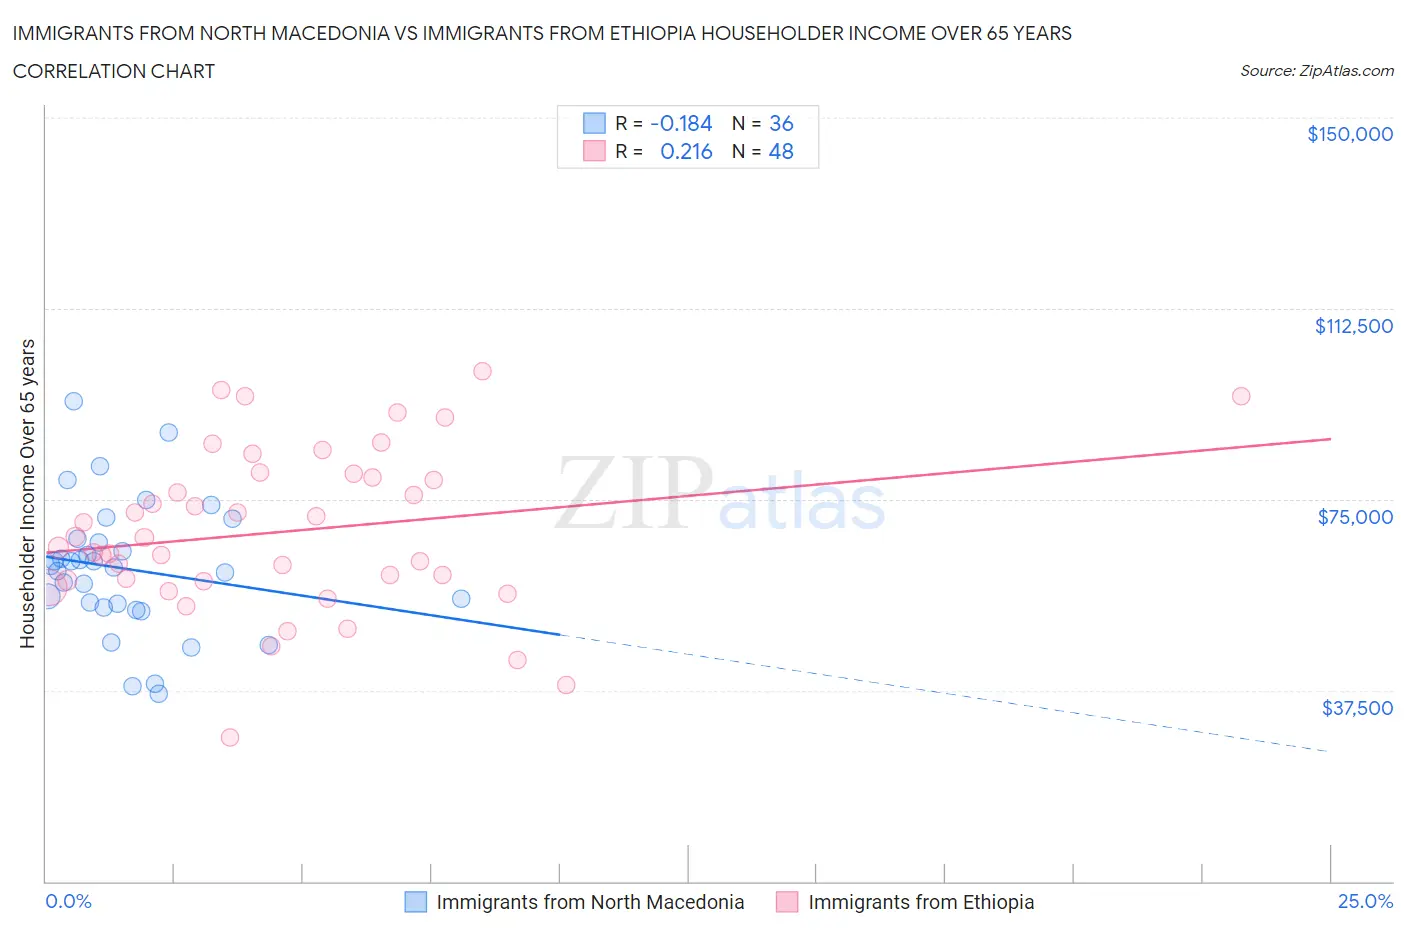
Immigrants from North Macedonia vs Immigrants from Ethiopia Householder Income Over 65 years Correlation Chart
The statistical analysis conducted on geographies consisting of 74,241,518 people shows a poor negative correlation between the proportion of Immigrants from North Macedonia and household income with householder over the age of 65 in the United States with a correlation coefficient (R) of -0.184 and weighted average of $61,175. Similarly, the statistical analysis conducted on geographies consisting of 211,200,149 people shows a weak positive correlation between the proportion of Immigrants from Ethiopia and household income with householder over the age of 65 in the United States with a correlation coefficient (R) of 0.216 and weighted average of $65,238, a difference of 6.6%.
Householder Income Over 65 years Correlation Summary
| Measurement | Immigrants from North Macedonia | Immigrants from Ethiopia |
| Minimum | $36,717 | $28,223 |
| Maximum | $94,385 | $100,125 |
| Range | $57,668 | $71,902 |
| Mean | $61,330 | $68,646 |
| Median | $61,846 | $66,533 |
| Interquartile 25% (IQ1) | $54,077 | $59,045 |
| Interquartile 75% (IQ3) | $66,915 | $79,658 |
| Interquartile Range (IQR) | $12,838 | $20,613 |
| Standard Deviation (Sample) | $12,892 | $15,885 |
| Standard Deviation (Population) | $12,712 | $15,718 |
Similar Demographics by Householder Income Over 65 years
Demographics Similar to Immigrants from North Macedonia by Householder Income Over 65 years
In terms of householder income over 65 years, the demographic groups most similar to Immigrants from North Macedonia are Ugandan ($61,177, a difference of 0.0%), Immigrants from Ukraine ($61,163, a difference of 0.020%), Immigrants from Eastern Africa ($61,157, a difference of 0.030%), Czech ($61,244, a difference of 0.11%), and Norwegian ($61,104, a difference of 0.12%).
| Demographics | Rating | Rank | Householder Income Over 65 years |
| Macedonians | 65.1 /100 | #157 | Good $61,564 |
| English | 63.3 /100 | #158 | Good $61,487 |
| Brazilians | 62.7 /100 | #159 | Good $61,465 |
| Portuguese | 62.1 /100 | #160 | Good $61,440 |
| Icelanders | 57.9 /100 | #161 | Average $61,270 |
| Czechs | 57.2 /100 | #162 | Average $61,244 |
| Ugandans | 55.5 /100 | #163 | Average $61,177 |
| Immigrants | North Macedonia | 55.4 /100 | #164 | Average $61,175 |
| Immigrants | Ukraine | 55.1 /100 | #165 | Average $61,163 |
| Immigrants | Eastern Africa | 55.0 /100 | #166 | Average $61,157 |
| Norwegians | 53.6 /100 | #167 | Average $61,104 |
| Irish | 53.4 /100 | #168 | Average $61,097 |
| Carpatho Rusyns | 53.3 /100 | #169 | Average $61,093 |
| Serbians | 53.1 /100 | #170 | Average $61,087 |
| Inupiat | 52.4 /100 | #171 | Average $61,061 |
Demographics Similar to Immigrants from Ethiopia by Householder Income Over 65 years
In terms of householder income over 65 years, the demographic groups most similar to Immigrants from Ethiopia are Argentinean ($65,246, a difference of 0.010%), Lithuanian ($65,209, a difference of 0.040%), Greek ($65,306, a difference of 0.10%), Mongolian ($65,326, a difference of 0.13%), and Samoan ($65,427, a difference of 0.29%).
| Demographics | Rating | Rank | Householder Income Over 65 years |
| South Africans | 99.3 /100 | #66 | Exceptional $65,652 |
| Immigrants | Malaysia | 99.1 /100 | #67 | Exceptional $65,497 |
| Egyptians | 99.1 /100 | #68 | Exceptional $65,441 |
| Samoans | 99.1 /100 | #69 | Exceptional $65,427 |
| Mongolians | 99.0 /100 | #70 | Exceptional $65,326 |
| Greeks | 98.9 /100 | #71 | Exceptional $65,306 |
| Argentineans | 98.9 /100 | #72 | Exceptional $65,246 |
| Immigrants | Ethiopia | 98.9 /100 | #73 | Exceptional $65,238 |
| Lithuanians | 98.8 /100 | #74 | Exceptional $65,209 |
| Sierra Leoneans | 98.6 /100 | #75 | Exceptional $65,038 |
| Ethiopians | 98.5 /100 | #76 | Exceptional $64,989 |
| Immigrants | Canada | 98.5 /100 | #77 | Exceptional $64,952 |
| Immigrants | Western Europe | 98.5 /100 | #78 | Exceptional $64,933 |
| Hawaiians | 98.4 /100 | #79 | Exceptional $64,920 |
| Immigrants | North America | 98.3 /100 | #80 | Exceptional $64,856 |