Immigrants from Kuwait vs Czech Median Female Earnings
COMPARE
Immigrants from Kuwait
Czech
Median Female Earnings
Median Female Earnings Comparison
Immigrants from Kuwait
Czechs
$41,055
MEDIAN FEMALE EARNINGS
94.4/ 100
METRIC RATING
120th/ 347
METRIC RANK
$38,992
MEDIAN FEMALE EARNINGS
18.7/ 100
METRIC RATING
203rd/ 347
METRIC RANK
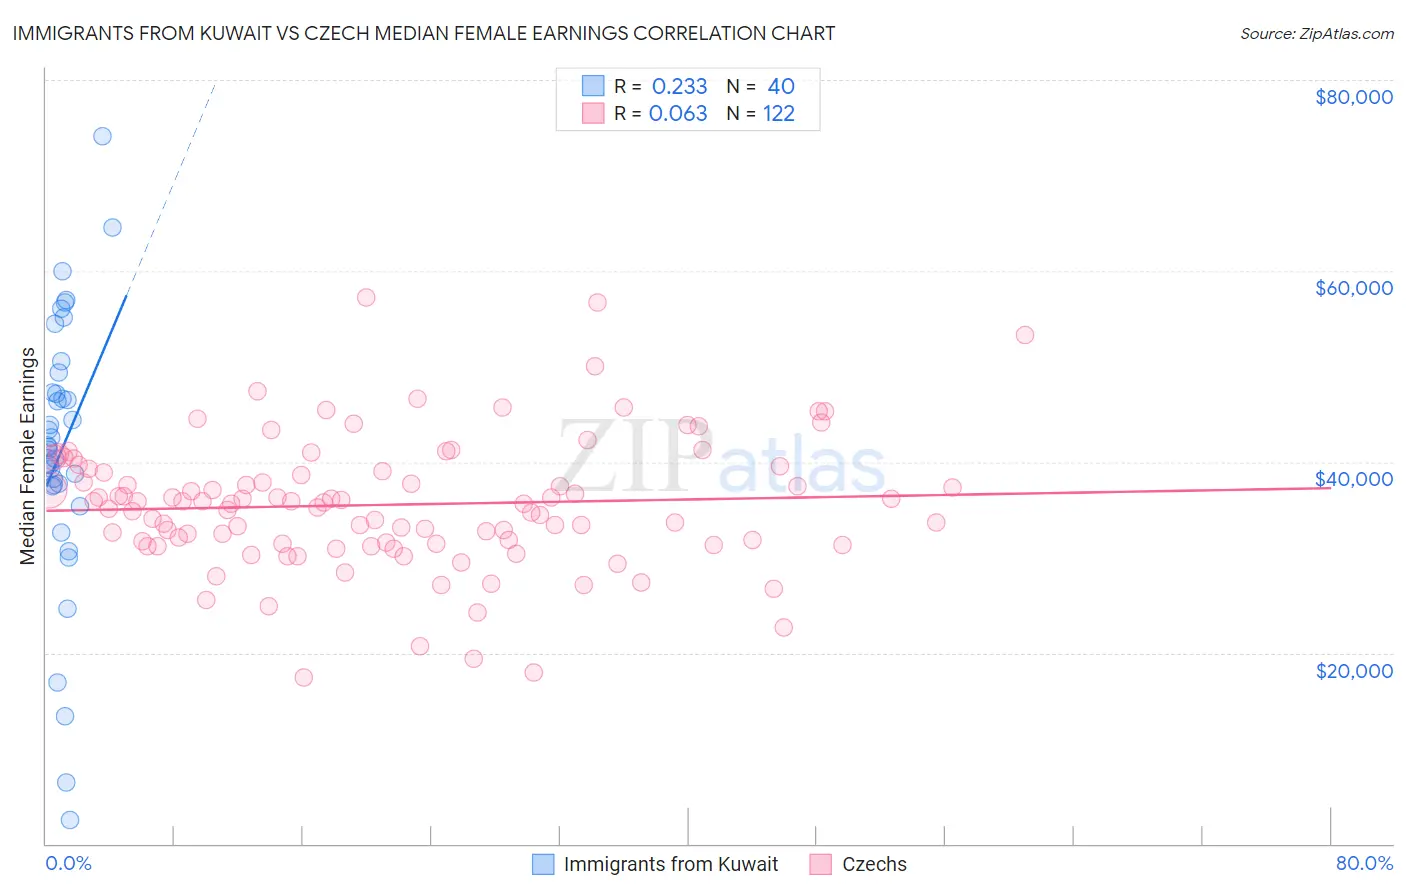
Immigrants from Kuwait vs Czech Median Female Earnings Correlation Chart
The statistical analysis conducted on geographies consisting of 136,915,503 people shows a weak positive correlation between the proportion of Immigrants from Kuwait and median female earnings in the United States with a correlation coefficient (R) of 0.233 and weighted average of $41,055. Similarly, the statistical analysis conducted on geographies consisting of 484,306,761 people shows a slight positive correlation between the proportion of Czechs and median female earnings in the United States with a correlation coefficient (R) of 0.063 and weighted average of $38,992, a difference of 5.3%.
Median Female Earnings Correlation Summary
| Measurement | Immigrants from Kuwait | Czech |
| Minimum | $2,499 | $17,404 |
| Maximum | $74,079 | $57,188 |
| Range | $71,580 | $39,784 |
| Mean | $41,287 | $35,507 |
| Median | $41,597 | $35,690 |
| Interquartile 25% (IQ1) | $37,555 | $31,400 |
| Interquartile 75% (IQ3) | $48,255 | $39,083 |
| Interquartile Range (IQR) | $10,700 | $7,683 |
| Standard Deviation (Sample) | $14,451 | $6,872 |
| Standard Deviation (Population) | $14,269 | $6,843 |
Similar Demographics by Median Female Earnings
Demographics Similar to Immigrants from Kuwait by Median Female Earnings
In terms of median female earnings, the demographic groups most similar to Immigrants from Kuwait are Immigrants from Philippines ($41,114, a difference of 0.15%), Croatian ($40,993, a difference of 0.15%), Immigrants from Jordan ($40,977, a difference of 0.19%), Guyanese ($40,973, a difference of 0.20%), and Trinidadian and Tobagonian ($40,958, a difference of 0.24%).
| Demographics | Rating | Rank | Median Female Earnings |
| Macedonians | 96.4 /100 | #113 | Exceptional $41,286 |
| Immigrants | England | 96.4 /100 | #114 | Exceptional $41,277 |
| Koreans | 96.4 /100 | #115 | Exceptional $41,276 |
| Immigrants | Brazil | 96.4 /100 | #116 | Exceptional $41,273 |
| Barbadians | 96.3 /100 | #117 | Exceptional $41,261 |
| Immigrants | Lebanon | 95.6 /100 | #118 | Exceptional $41,183 |
| Immigrants | Philippines | 95.0 /100 | #119 | Exceptional $41,114 |
| Immigrants | Kuwait | 94.4 /100 | #120 | Exceptional $41,055 |
| Croatians | 93.7 /100 | #121 | Exceptional $40,993 |
| Immigrants | Jordan | 93.5 /100 | #122 | Exceptional $40,977 |
| Guyanese | 93.4 /100 | #123 | Exceptional $40,973 |
| Trinidadians and Tobagonians | 93.2 /100 | #124 | Exceptional $40,958 |
| Austrians | 92.7 /100 | #125 | Exceptional $40,923 |
| Immigrants | Trinidad and Tobago | 92.3 /100 | #126 | Exceptional $40,895 |
| Ugandans | 92.2 /100 | #127 | Exceptional $40,889 |
Demographics Similar to Czechs by Median Female Earnings
In terms of median female earnings, the demographic groups most similar to Czechs are Slovak ($39,029, a difference of 0.090%), Immigrants from Uruguay ($38,945, a difference of 0.12%), Immigrants from Panama ($39,049, a difference of 0.15%), Panamanian ($39,049, a difference of 0.15%), and Immigrants from Colombia ($38,913, a difference of 0.20%).
| Demographics | Rating | Rank | Median Female Earnings |
| Immigrants | Costa Rica | 25.6 /100 | #196 | Fair $39,186 |
| Assyrians/Chaldeans/Syriacs | 24.6 /100 | #197 | Fair $39,159 |
| Ecuadorians | 23.0 /100 | #198 | Fair $39,117 |
| Icelanders | 22.7 /100 | #199 | Fair $39,109 |
| Immigrants | Panama | 20.6 /100 | #200 | Fair $39,049 |
| Panamanians | 20.6 /100 | #201 | Fair $39,049 |
| Slovaks | 19.9 /100 | #202 | Poor $39,029 |
| Czechs | 18.7 /100 | #203 | Poor $38,992 |
| Immigrants | Uruguay | 17.3 /100 | #204 | Poor $38,945 |
| Immigrants | Colombia | 16.3 /100 | #205 | Poor $38,913 |
| Immigrants | Bosnia and Herzegovina | 15.6 /100 | #206 | Poor $38,886 |
| Immigrants | Cambodia | 14.2 /100 | #207 | Poor $38,833 |
| Immigrants | Thailand | 13.6 /100 | #208 | Poor $38,810 |
| Norwegians | 13.4 /100 | #209 | Poor $38,802 |
| Czechoslovakians | 12.0 /100 | #210 | Poor $38,738 |