Immigrants from Latvia vs New Zealander Median Female Earnings
COMPARE
Immigrants from Latvia
New Zealander
Median Female Earnings
Median Female Earnings Comparison
Immigrants from Latvia
New Zealanders
$43,099
MEDIAN FEMALE EARNINGS
99.9/ 100
METRIC RATING
60th/ 347
METRIC RANK
$42,446
MEDIAN FEMALE EARNINGS
99.7/ 100
METRIC RATING
75th/ 347
METRIC RANK
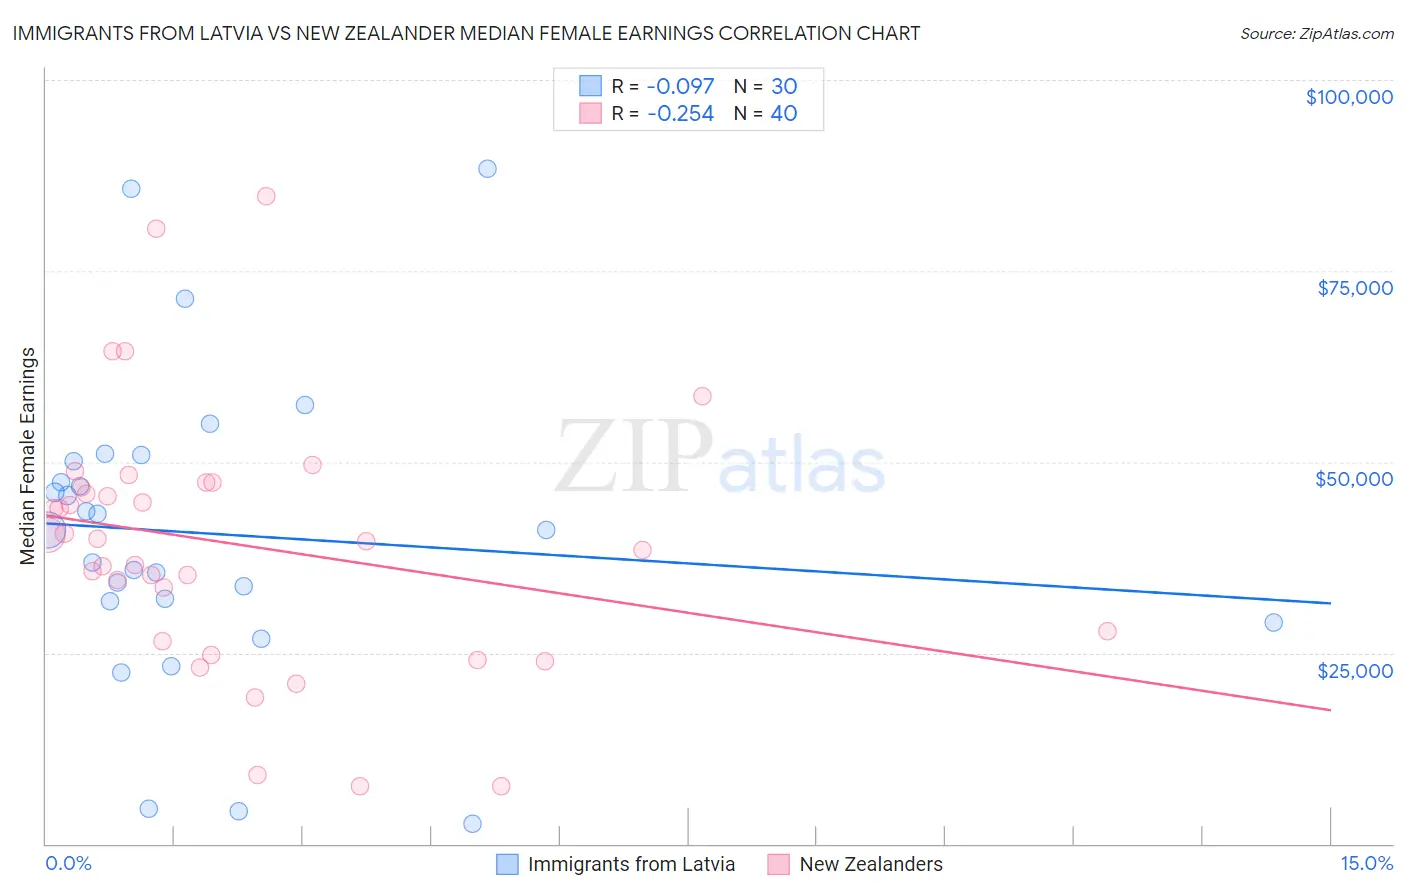
Immigrants from Latvia vs New Zealander Median Female Earnings Correlation Chart
The statistical analysis conducted on geographies consisting of 113,735,642 people shows a slight negative correlation between the proportion of Immigrants from Latvia and median female earnings in the United States with a correlation coefficient (R) of -0.097 and weighted average of $43,099. Similarly, the statistical analysis conducted on geographies consisting of 106,911,016 people shows a weak negative correlation between the proportion of New Zealanders and median female earnings in the United States with a correlation coefficient (R) of -0.254 and weighted average of $42,446, a difference of 1.5%.
Median Female Earnings Correlation Summary
| Measurement | Immigrants from Latvia | New Zealander |
| Minimum | $2,606 | $7,500 |
| Maximum | $88,365 | $84,792 |
| Range | $85,759 | $77,292 |
| Mean | $40,583 | $39,221 |
| Median | $41,080 | $39,778 |
| Interquartile 25% (IQ1) | $31,765 | $27,127 |
| Interquartile 75% (IQ3) | $50,109 | $46,939 |
| Interquartile Range (IQR) | $18,344 | $19,812 |
| Standard Deviation (Sample) | $19,932 | $16,864 |
| Standard Deviation (Population) | $19,597 | $16,651 |
Demographics Similar to Immigrants from Latvia and New Zealanders by Median Female Earnings
In terms of median female earnings, the demographic groups most similar to Immigrants from Latvia are Estonian ($43,106, a difference of 0.020%), Immigrants from Bulgaria ($43,085, a difference of 0.030%), Afghan ($43,077, a difference of 0.050%), Immigrants from Ukraine ($43,069, a difference of 0.070%), and Immigrants from Pakistan ($43,052, a difference of 0.11%). Similarly, the demographic groups most similar to New Zealanders are Immigrants from Italy ($42,446, a difference of 0.0%), Immigrants from Albania ($42,388, a difference of 0.14%), Immigrants from South Africa ($42,508, a difference of 0.15%), Mongolian ($42,542, a difference of 0.23%), and Albanian ($42,584, a difference of 0.32%).
| Demographics | Rating | Rank | Median Female Earnings |
| Ethiopians | 99.9 /100 | #57 | Exceptional $43,243 |
| Paraguayans | 99.9 /100 | #58 | Exceptional $43,173 |
| Estonians | 99.9 /100 | #59 | Exceptional $43,106 |
| Immigrants | Latvia | 99.9 /100 | #60 | Exceptional $43,099 |
| Immigrants | Bulgaria | 99.9 /100 | #61 | Exceptional $43,085 |
| Afghans | 99.9 /100 | #62 | Exceptional $43,077 |
| Immigrants | Ukraine | 99.9 /100 | #63 | Exceptional $43,069 |
| Immigrants | Pakistan | 99.9 /100 | #64 | Exceptional $43,052 |
| Sierra Leoneans | 99.9 /100 | #65 | Exceptional $42,868 |
| Immigrants | Norway | 99.9 /100 | #66 | Exceptional $42,837 |
| Immigrants | Egypt | 99.9 /100 | #67 | Exceptional $42,837 |
| Immigrants | Austria | 99.8 /100 | #68 | Exceptional $42,824 |
| Immigrants | Spain | 99.8 /100 | #69 | Exceptional $42,815 |
| Immigrants | Ethiopia | 99.8 /100 | #70 | Exceptional $42,744 |
| Immigrants | Romania | 99.8 /100 | #71 | Exceptional $42,718 |
| Albanians | 99.8 /100 | #72 | Exceptional $42,584 |
| Mongolians | 99.7 /100 | #73 | Exceptional $42,542 |
| Immigrants | South Africa | 99.7 /100 | #74 | Exceptional $42,508 |
| New Zealanders | 99.7 /100 | #75 | Exceptional $42,446 |
| Immigrants | Italy | 99.7 /100 | #76 | Exceptional $42,446 |
| Immigrants | Albania | 99.6 /100 | #77 | Exceptional $42,388 |