Immigrants from Netherlands vs Spanish American Indian Median Female Earnings
COMPARE
Immigrants from Netherlands
Spanish American Indian
Median Female Earnings
Median Female Earnings Comparison
Immigrants from Netherlands
Spanish American Indians
$41,870
MEDIAN FEMALE EARNINGS
98.9/ 100
METRIC RATING
95th/ 347
METRIC RANK
$33,625
MEDIAN FEMALE EARNINGS
0.0/ 100
METRIC RATING
334th/ 347
METRIC RANK
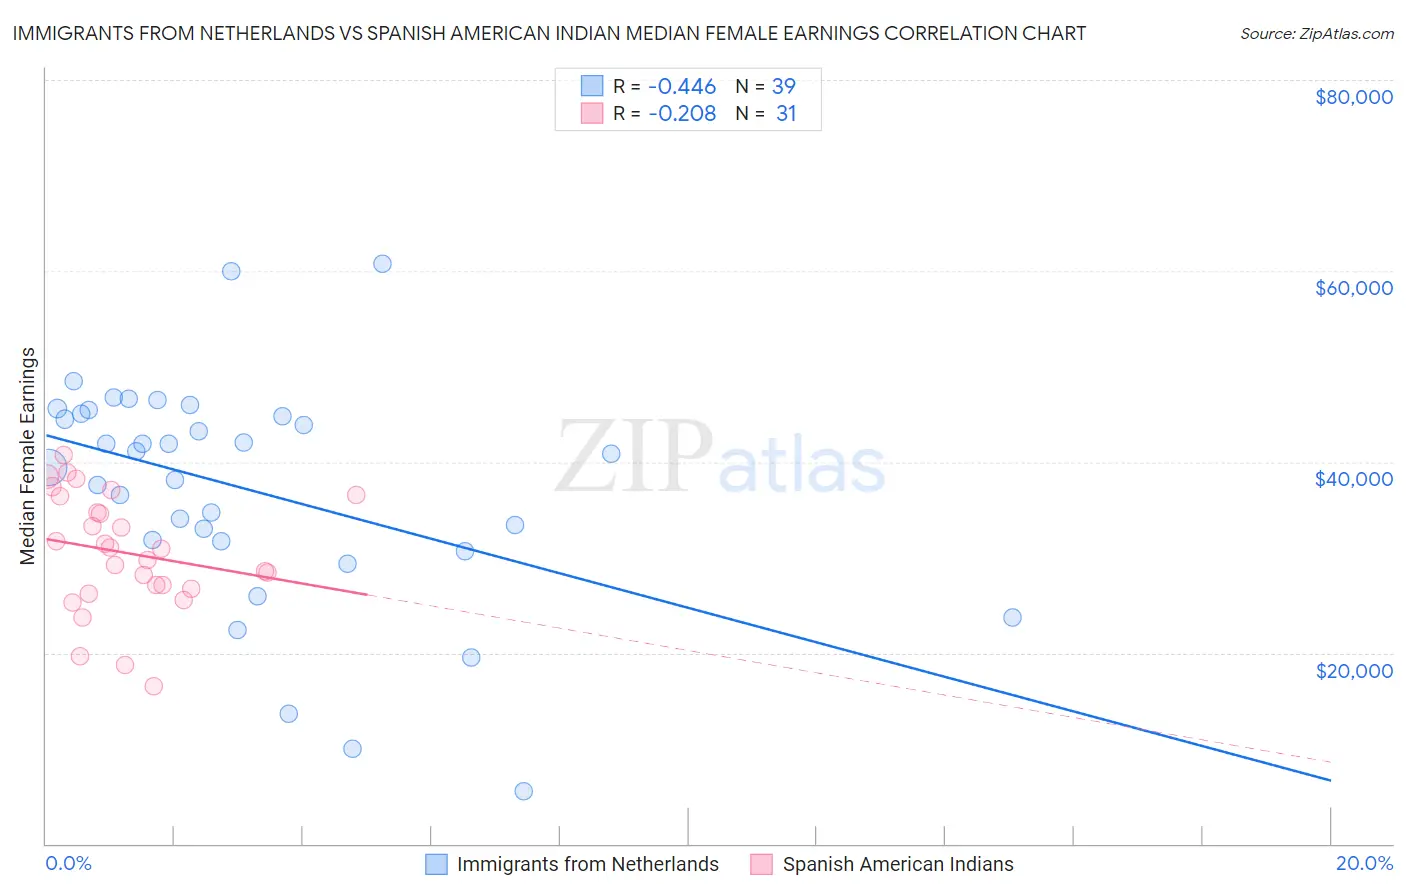
Immigrants from Netherlands vs Spanish American Indian Median Female Earnings Correlation Chart
The statistical analysis conducted on geographies consisting of 237,807,250 people shows a moderate negative correlation between the proportion of Immigrants from Netherlands and median female earnings in the United States with a correlation coefficient (R) of -0.446 and weighted average of $41,870. Similarly, the statistical analysis conducted on geographies consisting of 73,144,962 people shows a weak negative correlation between the proportion of Spanish American Indians and median female earnings in the United States with a correlation coefficient (R) of -0.208 and weighted average of $33,625, a difference of 24.5%.
Median Female Earnings Correlation Summary
| Measurement | Immigrants from Netherlands | Spanish American Indian |
| Minimum | $5,512 | $16,510 |
| Maximum | $60,703 | $40,753 |
| Range | $55,191 | $24,243 |
| Mean | $37,129 | $30,468 |
| Median | $40,875 | $30,907 |
| Interquartile 25% (IQ1) | $31,744 | $26,648 |
| Interquartile 75% (IQ3) | $45,060 | $36,401 |
| Interquartile Range (IQR) | $13,315 | $9,753 |
| Standard Deviation (Sample) | $11,943 | $6,157 |
| Standard Deviation (Population) | $11,789 | $6,057 |
Similar Demographics by Median Female Earnings
Demographics Similar to Immigrants from Netherlands by Median Female Earnings
In terms of median female earnings, the demographic groups most similar to Immigrants from Netherlands are Moroccan ($41,872, a difference of 0.0%), South African ($41,825, a difference of 0.11%), Immigrants from Hungary ($41,820, a difference of 0.12%), Immigrants from Grenada ($41,932, a difference of 0.15%), and Argentinean ($41,952, a difference of 0.20%).
| Demographics | Rating | Rank | Median Female Earnings |
| Immigrants | Northern Africa | 99.3 /100 | #88 | Exceptional $42,084 |
| Immigrants | Afghanistan | 99.3 /100 | #89 | Exceptional $42,055 |
| Ukrainians | 99.2 /100 | #90 | Exceptional $42,015 |
| Immigrants | Western Europe | 99.2 /100 | #91 | Exceptional $41,990 |
| Argentineans | 99.1 /100 | #92 | Exceptional $41,952 |
| Immigrants | Grenada | 99.0 /100 | #93 | Exceptional $41,932 |
| Moroccans | 98.9 /100 | #94 | Exceptional $41,872 |
| Immigrants | Netherlands | 98.9 /100 | #95 | Exceptional $41,870 |
| South Africans | 98.8 /100 | #96 | Exceptional $41,825 |
| Immigrants | Hungary | 98.8 /100 | #97 | Exceptional $41,820 |
| Immigrants | Scotland | 98.7 /100 | #98 | Exceptional $41,771 |
| Immigrants | Barbados | 98.4 /100 | #99 | Exceptional $41,685 |
| Romanians | 98.3 /100 | #100 | Exceptional $41,663 |
| Immigrants | Fiji | 98.3 /100 | #101 | Exceptional $41,656 |
| Immigrants | Poland | 98.2 /100 | #102 | Exceptional $41,630 |
Demographics Similar to Spanish American Indians by Median Female Earnings
In terms of median female earnings, the demographic groups most similar to Spanish American Indians are Mexican ($33,664, a difference of 0.12%), Choctaw ($33,775, a difference of 0.45%), Native/Alaskan ($33,806, a difference of 0.54%), Creek ($33,437, a difference of 0.56%), and Ottawa ($33,378, a difference of 0.74%).
| Demographics | Rating | Rank | Median Female Earnings |
| Cajuns | 0.0 /100 | #327 | Tragic $34,034 |
| Immigrants | Central America | 0.0 /100 | #328 | Tragic $33,953 |
| Hopi | 0.0 /100 | #329 | Tragic $33,932 |
| Menominee | 0.0 /100 | #330 | Tragic $33,894 |
| Natives/Alaskans | 0.0 /100 | #331 | Tragic $33,806 |
| Choctaw | 0.0 /100 | #332 | Tragic $33,775 |
| Mexicans | 0.0 /100 | #333 | Tragic $33,664 |
| Spanish American Indians | 0.0 /100 | #334 | Tragic $33,625 |
| Creek | 0.0 /100 | #335 | Tragic $33,437 |
| Ottawa | 0.0 /100 | #336 | Tragic $33,378 |
| Yakama | 0.0 /100 | #337 | Tragic $33,354 |
| Immigrants | Cuba | 0.0 /100 | #338 | Tragic $33,291 |
| Immigrants | Mexico | 0.0 /100 | #339 | Tragic $33,236 |
| Tohono O'odham | 0.0 /100 | #340 | Tragic $33,205 |
| Navajo | 0.0 /100 | #341 | Tragic $33,046 |