Immigrants from Kenya vs Crow Median Household Income
COMPARE
Immigrants from Kenya
Crow
Median Household Income
Median Household Income Comparison
Immigrants from Kenya
Crow
$83,068
MEDIAN HOUSEHOLD INCOME
21.3/ 100
METRIC RATING
206th/ 347
METRIC RANK
$63,681
MEDIAN HOUSEHOLD INCOME
0.0/ 100
METRIC RATING
341st/ 347
METRIC RANK
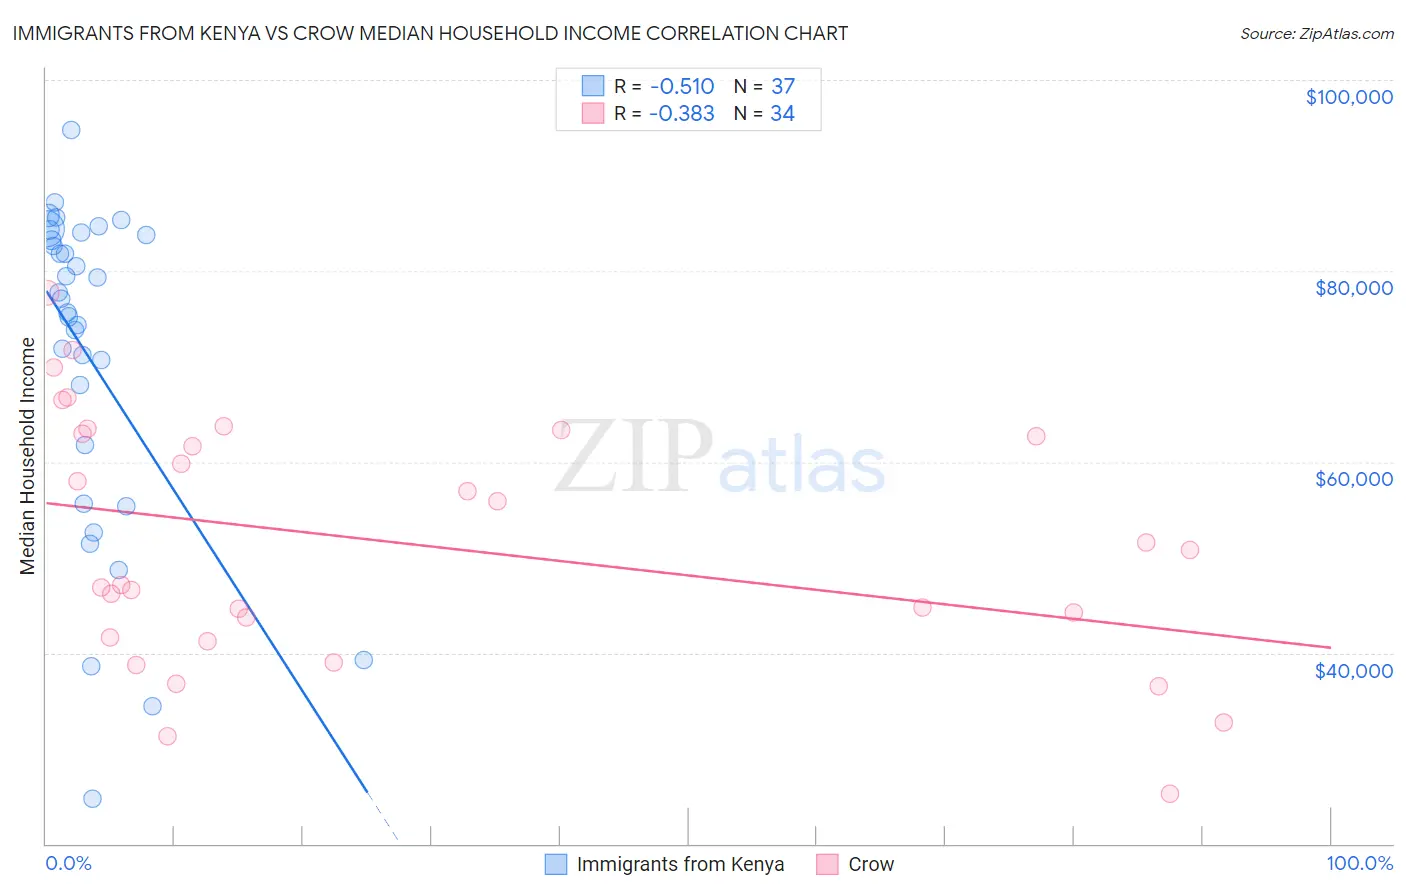
Immigrants from Kenya vs Crow Median Household Income Correlation Chart
The statistical analysis conducted on geographies consisting of 217,959,858 people shows a substantial negative correlation between the proportion of Immigrants from Kenya and median household income in the United States with a correlation coefficient (R) of -0.510 and weighted average of $83,068. Similarly, the statistical analysis conducted on geographies consisting of 59,197,360 people shows a mild negative correlation between the proportion of Crow and median household income in the United States with a correlation coefficient (R) of -0.383 and weighted average of $63,681, a difference of 30.4%.
Median Household Income Correlation Summary
| Measurement | Immigrants from Kenya | Crow |
| Minimum | $24,660 | $25,179 |
| Maximum | $94,729 | $77,725 |
| Range | $70,069 | $52,546 |
| Mean | $70,990 | $51,476 |
| Median | $77,036 | $48,948 |
| Interquartile 25% (IQ1) | $58,646 | $41,650 |
| Interquartile 75% (IQ3) | $83,895 | $62,906 |
| Interquartile Range (IQR) | $25,249 | $21,256 |
| Standard Deviation (Sample) | $17,137 | $12,984 |
| Standard Deviation (Population) | $16,903 | $12,792 |
Similar Demographics by Median Household Income
Demographics Similar to Immigrants from Kenya by Median Household Income
In terms of median household income, the demographic groups most similar to Immigrants from Kenya are Dutch ($82,971, a difference of 0.12%), Celtic ($83,193, a difference of 0.15%), Immigrants from Africa ($83,289, a difference of 0.27%), Immigrants from Cambodia ($83,304, a difference of 0.28%), and Immigrants from Thailand ($83,327, a difference of 0.31%).
| Demographics | Rating | Rank | Median Household Income |
| Germans | 24.6 /100 | #199 | Fair $83,358 |
| Tsimshian | 24.5 /100 | #200 | Fair $83,346 |
| Spanish | 24.4 /100 | #201 | Fair $83,343 |
| Immigrants | Thailand | 24.3 /100 | #202 | Fair $83,327 |
| Immigrants | Cambodia | 24.0 /100 | #203 | Fair $83,304 |
| Immigrants | Africa | 23.8 /100 | #204 | Fair $83,289 |
| Celtics | 22.7 /100 | #205 | Fair $83,193 |
| Immigrants | Kenya | 21.3 /100 | #206 | Fair $83,068 |
| Dutch | 20.3 /100 | #207 | Fair $82,971 |
| French Canadians | 18.7 /100 | #208 | Poor $82,810 |
| Immigrants | Iraq | 16.7 /100 | #209 | Poor $82,594 |
| Immigrants | Uruguay | 16.4 /100 | #210 | Poor $82,560 |
| Salvadorans | 15.4 /100 | #211 | Poor $82,449 |
| Venezuelans | 15.3 /100 | #212 | Poor $82,432 |
| Nepalese | 15.1 /100 | #213 | Poor $82,410 |
Demographics Similar to Crow by Median Household Income
In terms of median household income, the demographic groups most similar to Crow are Pima ($63,262, a difference of 0.66%), Pueblo ($64,692, a difference of 1.6%), Houma ($62,575, a difference of 1.8%), Hopi ($65,043, a difference of 2.1%), and Immigrants from Yemen ($65,194, a difference of 2.4%).
| Demographics | Rating | Rank | Median Household Income |
| Creek | 0.0 /100 | #333 | Tragic $67,715 |
| Blacks/African Americans | 0.0 /100 | #334 | Tragic $67,573 |
| Cheyenne | 0.0 /100 | #335 | Tragic $66,974 |
| Immigrants | Congo | 0.0 /100 | #336 | Tragic $66,768 |
| Kiowa | 0.0 /100 | #337 | Tragic $65,914 |
| Immigrants | Yemen | 0.0 /100 | #338 | Tragic $65,194 |
| Hopi | 0.0 /100 | #339 | Tragic $65,043 |
| Pueblo | 0.0 /100 | #340 | Tragic $64,692 |
| Crow | 0.0 /100 | #341 | Tragic $63,681 |
| Pima | 0.0 /100 | #342 | Tragic $63,262 |
| Houma | 0.0 /100 | #343 | Tragic $62,575 |
| Tohono O'odham | 0.0 /100 | #344 | Tragic $61,663 |
| Puerto Ricans | 0.0 /100 | #345 | Tragic $59,197 |
| Navajo | 0.0 /100 | #346 | Tragic $59,159 |
| Lumbee | 0.0 /100 | #347 | Tragic $54,644 |