Immigrants from Morocco vs Immigrants from Liberia Median Household Income
COMPARE
Immigrants from Morocco
Immigrants from Liberia
Median Household Income
Median Household Income Comparison
Immigrants from Morocco
Immigrants from Liberia
$87,930
MEDIAN HOUSEHOLD INCOME
86.0/ 100
METRIC RATING
141st/ 347
METRIC RANK
$74,896
MEDIAN HOUSEHOLD INCOME
0.1/ 100
METRIC RATING
281st/ 347
METRIC RANK
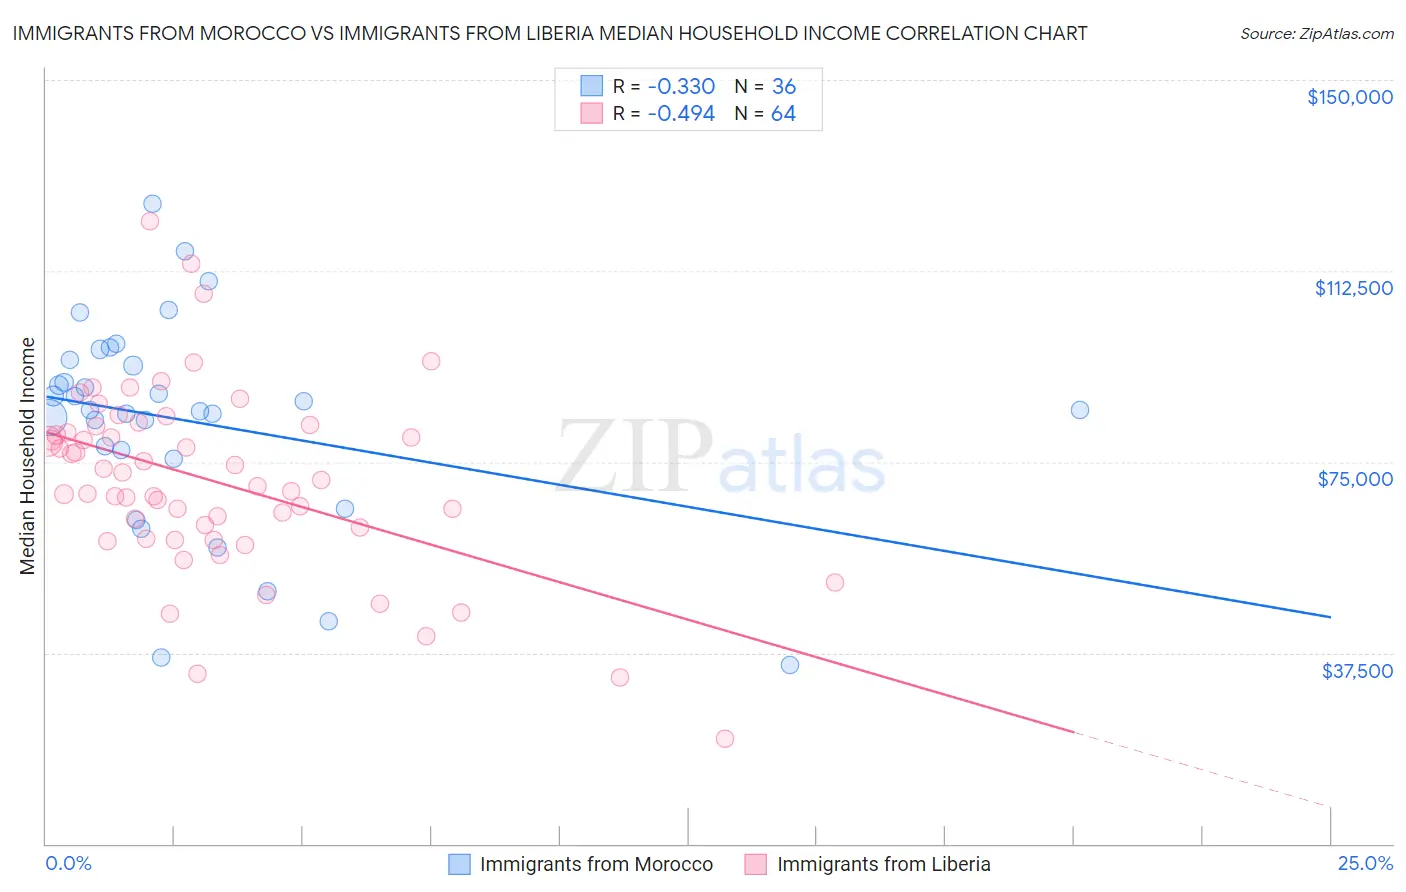
Immigrants from Morocco vs Immigrants from Liberia Median Household Income Correlation Chart
The statistical analysis conducted on geographies consisting of 178,909,382 people shows a mild negative correlation between the proportion of Immigrants from Morocco and median household income in the United States with a correlation coefficient (R) of -0.330 and weighted average of $87,930. Similarly, the statistical analysis conducted on geographies consisting of 135,245,010 people shows a moderate negative correlation between the proportion of Immigrants from Liberia and median household income in the United States with a correlation coefficient (R) of -0.494 and weighted average of $74,896, a difference of 17.4%.
Median Household Income Correlation Summary
| Measurement | Immigrants from Morocco | Immigrants from Liberia |
| Minimum | $35,000 | $20,699 |
| Maximum | $125,707 | $122,146 |
| Range | $90,707 | $101,447 |
| Mean | $82,911 | $71,180 |
| Median | $85,268 | $70,898 |
| Interquartile 25% (IQ1) | $76,412 | $61,014 |
| Interquartile 75% (IQ3) | $94,485 | $81,401 |
| Interquartile Range (IQR) | $18,073 | $20,387 |
| Standard Deviation (Sample) | $20,524 | $18,219 |
| Standard Deviation (Population) | $20,237 | $18,076 |
Similar Demographics by Median Household Income
Demographics Similar to Immigrants from Morocco by Median Household Income
In terms of median household income, the demographic groups most similar to Immigrants from Morocco are Lebanese ($88,091, a difference of 0.18%), Canadian ($87,769, a difference of 0.18%), Danish ($87,676, a difference of 0.29%), Serbian ($87,572, a difference of 0.41%), and Ugandan ($87,557, a difference of 0.43%).
| Demographics | Rating | Rank | Median Household Income |
| Swedes | 90.0 /100 | #134 | Exceptional $88,524 |
| Immigrants | Sierra Leone | 89.9 /100 | #135 | Excellent $88,498 |
| Poles | 89.7 /100 | #136 | Excellent $88,472 |
| Sierra Leoneans | 89.6 /100 | #137 | Excellent $88,463 |
| Arabs | 89.2 /100 | #138 | Excellent $88,398 |
| Immigrants | Chile | 89.2 /100 | #139 | Excellent $88,388 |
| Lebanese | 87.2 /100 | #140 | Excellent $88,091 |
| Immigrants | Morocco | 86.0 /100 | #141 | Excellent $87,930 |
| Canadians | 84.7 /100 | #142 | Excellent $87,769 |
| Danes | 83.9 /100 | #143 | Excellent $87,676 |
| Serbians | 83.0 /100 | #144 | Excellent $87,572 |
| Ugandans | 82.9 /100 | #145 | Excellent $87,557 |
| Immigrants | Uganda | 82.8 /100 | #146 | Excellent $87,553 |
| South American Indians | 81.8 /100 | #147 | Excellent $87,446 |
| Costa Ricans | 80.0 /100 | #148 | Excellent $87,262 |
Demographics Similar to Immigrants from Liberia by Median Household Income
In terms of median household income, the demographic groups most similar to Immigrants from Liberia are Central American Indian ($74,847, a difference of 0.070%), Senegalese ($74,999, a difference of 0.14%), Cree ($74,685, a difference of 0.28%), Immigrants from Guatemala ($75,123, a difference of 0.30%), and Yaqui ($74,596, a difference of 0.40%).
| Demographics | Rating | Rank | Median Household Income |
| British West Indians | 0.2 /100 | #274 | Tragic $75,647 |
| Immigrants | Micronesia | 0.2 /100 | #275 | Tragic $75,574 |
| Immigrants | Latin America | 0.2 /100 | #276 | Tragic $75,420 |
| Spanish Americans | 0.2 /100 | #277 | Tragic $75,386 |
| Osage | 0.2 /100 | #278 | Tragic $75,240 |
| Immigrants | Guatemala | 0.2 /100 | #279 | Tragic $75,123 |
| Senegalese | 0.2 /100 | #280 | Tragic $74,999 |
| Immigrants | Liberia | 0.1 /100 | #281 | Tragic $74,896 |
| Central American Indians | 0.1 /100 | #282 | Tragic $74,847 |
| Cree | 0.1 /100 | #283 | Tragic $74,685 |
| Yaqui | 0.1 /100 | #284 | Tragic $74,596 |
| Mexicans | 0.1 /100 | #285 | Tragic $74,399 |
| Immigrants | Somalia | 0.1 /100 | #286 | Tragic $74,300 |
| Iroquois | 0.1 /100 | #287 | Tragic $74,279 |
| Immigrants | Central America | 0.1 /100 | #288 | Tragic $74,217 |