Spanish American Indian vs Immigrants from Germany Householder Income Ages 25 - 44 years
COMPARE
Spanish American Indian
Immigrants from Germany
Householder Income Ages 25 - 44 years
Householder Income Ages 25 - 44 years Comparison
Spanish American Indians
Immigrants from Germany
$84,085
HOUSEHOLDER INCOME AGES 25 - 44 YEARS
0.3/ 100
METRIC RATING
269th/ 347
METRIC RANK
$95,913
HOUSEHOLDER INCOME AGES 25 - 44 YEARS
67.9/ 100
METRIC RATING
156th/ 347
METRIC RANK
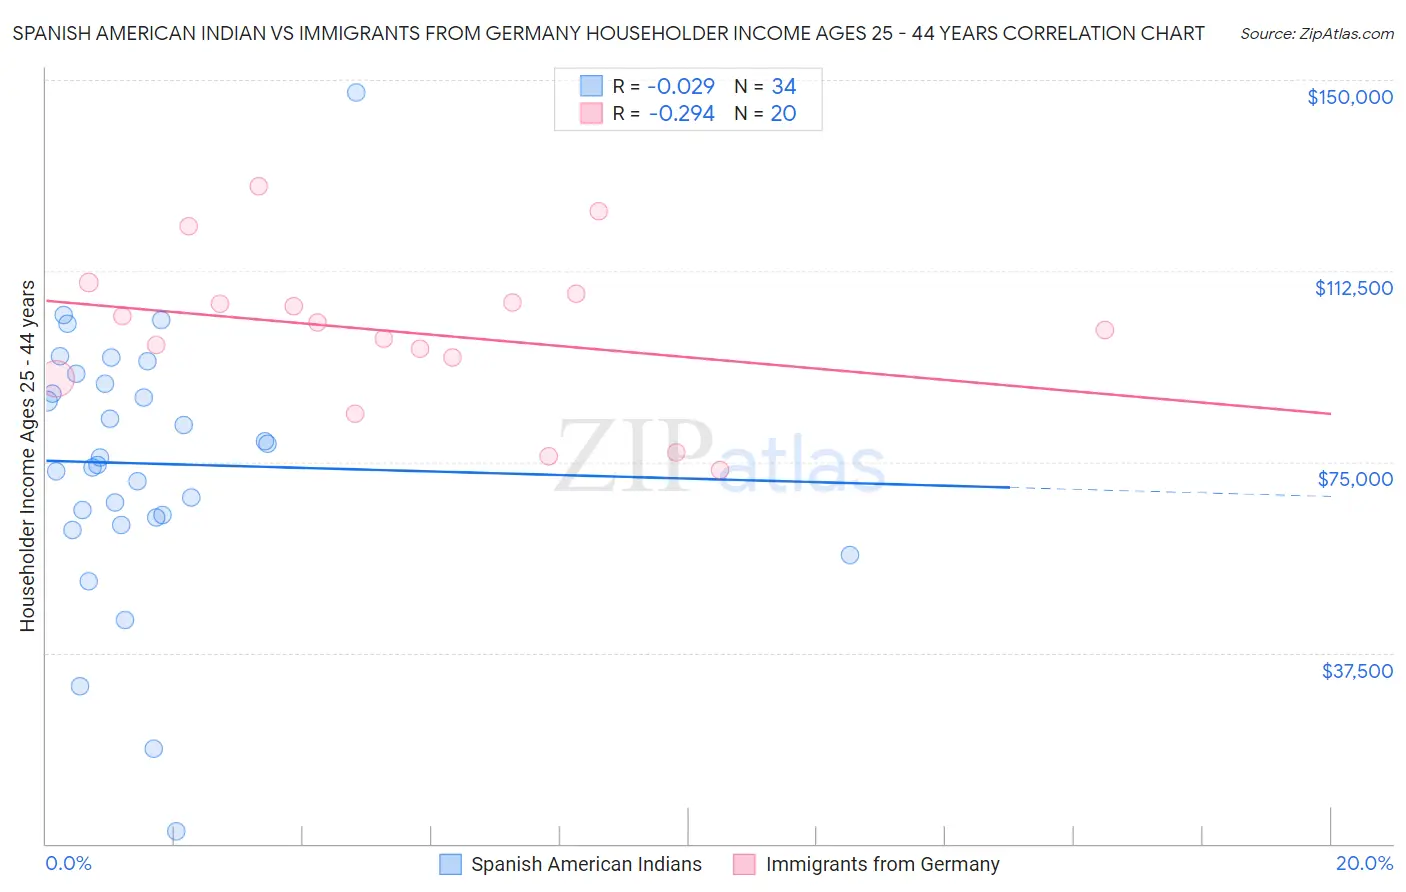
Spanish American Indian vs Immigrants from Germany Householder Income Ages 25 - 44 years Correlation Chart
The statistical analysis conducted on geographies consisting of 73,137,186 people shows no correlation between the proportion of Spanish American Indians and household income with householder between the ages 25 and 44 in the United States with a correlation coefficient (R) of -0.029 and weighted average of $84,085. Similarly, the statistical analysis conducted on geographies consisting of 462,354,902 people shows a weak negative correlation between the proportion of Immigrants from Germany and household income with householder between the ages 25 and 44 in the United States with a correlation coefficient (R) of -0.294 and weighted average of $95,913, a difference of 14.1%.
Householder Income Ages 25 - 44 years Correlation Summary
| Measurement | Spanish American Indian | Immigrants from Germany |
| Minimum | $2,499 | $73,472 |
| Maximum | $147,500 | $129,121 |
| Range | $145,001 | $55,649 |
| Mean | $74,648 | $100,474 |
| Median | $75,146 | $101,592 |
| Interquartile 25% (IQ1) | $64,148 | $93,342 |
| Interquartile 75% (IQ3) | $90,277 | $107,107 |
| Interquartile Range (IQR) | $26,129 | $13,765 |
| Standard Deviation (Sample) | $26,399 | $15,097 |
| Standard Deviation (Population) | $26,008 | $14,715 |
Similar Demographics by Householder Income Ages 25 - 44 years
Demographics Similar to Spanish American Indians by Householder Income Ages 25 - 44 years
In terms of householder income ages 25 - 44 years, the demographic groups most similar to Spanish American Indians are Subsaharan African ($84,235, a difference of 0.18%), Jamaican ($83,933, a difference of 0.18%), Hmong ($84,258, a difference of 0.21%), Immigrants from Cabo Verde ($84,304, a difference of 0.26%), and Sudanese ($84,401, a difference of 0.38%).
| Demographics | Rating | Rank | Householder Income Ages 25 - 44 years |
| Cree | 0.4 /100 | #262 | Tragic $84,574 |
| Belizeans | 0.4 /100 | #263 | Tragic $84,534 |
| Osage | 0.4 /100 | #264 | Tragic $84,461 |
| Sudanese | 0.4 /100 | #265 | Tragic $84,401 |
| Immigrants | Cabo Verde | 0.3 /100 | #266 | Tragic $84,304 |
| Hmong | 0.3 /100 | #267 | Tragic $84,258 |
| Sub-Saharan Africans | 0.3 /100 | #268 | Tragic $84,235 |
| Spanish American Indians | 0.3 /100 | #269 | Tragic $84,085 |
| Jamaicans | 0.3 /100 | #270 | Tragic $83,933 |
| Somalis | 0.2 /100 | #271 | Tragic $83,752 |
| Spanish Americans | 0.2 /100 | #272 | Tragic $83,722 |
| Iroquois | 0.2 /100 | #273 | Tragic $83,682 |
| Marshallese | 0.2 /100 | #274 | Tragic $83,575 |
| Immigrants | Jamaica | 0.2 /100 | #275 | Tragic $83,298 |
| Immigrants | Belize | 0.2 /100 | #276 | Tragic $83,141 |
Demographics Similar to Immigrants from Germany by Householder Income Ages 25 - 44 years
In terms of householder income ages 25 - 44 years, the demographic groups most similar to Immigrants from Germany are Moroccan ($96,117, a difference of 0.21%), Immigrants from Uganda ($95,698, a difference of 0.22%), Scandinavian ($95,596, a difference of 0.33%), Costa Rican ($95,565, a difference of 0.36%), and Icelander ($95,560, a difference of 0.37%).
| Demographics | Rating | Rank | Householder Income Ages 25 - 44 years |
| Basques | 76.6 /100 | #149 | Good $96,709 |
| Ugandans | 76.2 /100 | #150 | Good $96,667 |
| Czechs | 74.8 /100 | #151 | Good $96,525 |
| South American Indians | 74.5 /100 | #152 | Good $96,497 |
| Slovenes | 73.9 /100 | #153 | Good $96,439 |
| Slavs | 73.2 /100 | #154 | Good $96,377 |
| Moroccans | 70.3 /100 | #155 | Good $96,117 |
| Immigrants | Germany | 67.9 /100 | #156 | Good $95,913 |
| Immigrants | Uganda | 65.2 /100 | #157 | Good $95,698 |
| Scandinavians | 63.9 /100 | #158 | Good $95,596 |
| Costa Ricans | 63.5 /100 | #159 | Good $95,565 |
| Icelanders | 63.4 /100 | #160 | Good $95,560 |
| Immigrants | Portugal | 62.8 /100 | #161 | Good $95,512 |
| Swiss | 62.8 /100 | #162 | Good $95,511 |
| Immigrants | Saudi Arabia | 62.0 /100 | #163 | Good $95,450 |