Canadian vs Immigrants from Germany Householder Income Ages 25 - 44 years
COMPARE
Canadian
Immigrants from Germany
Householder Income Ages 25 - 44 years
Householder Income Ages 25 - 44 years Comparison
Canadians
Immigrants from Germany
$97,625
HOUSEHOLDER INCOME AGES 25 - 44 YEARS
84.5/ 100
METRIC RATING
134th/ 347
METRIC RANK
$95,913
HOUSEHOLDER INCOME AGES 25 - 44 YEARS
67.9/ 100
METRIC RATING
156th/ 347
METRIC RANK
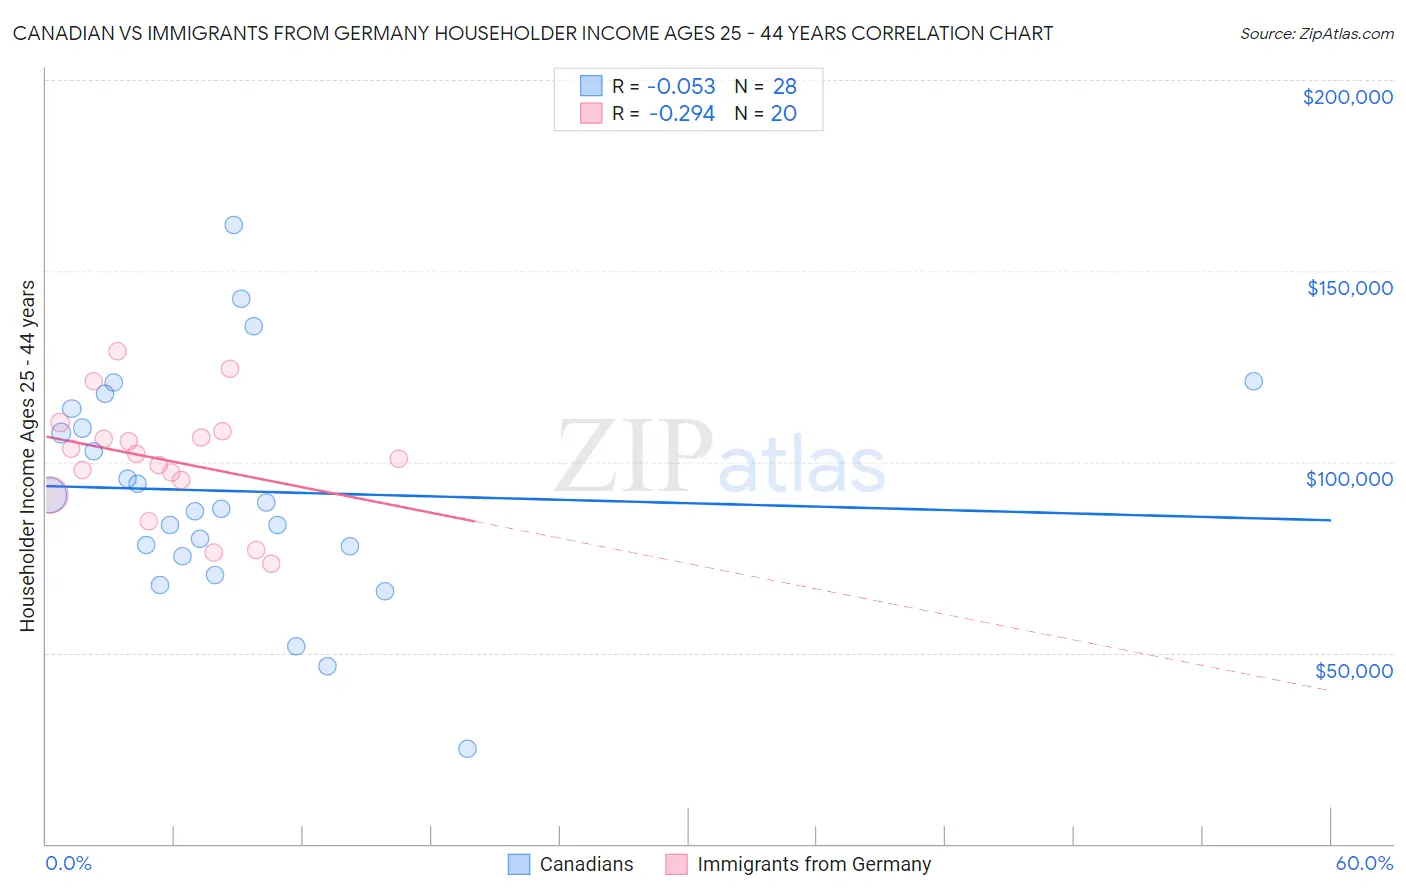
Canadian vs Immigrants from Germany Householder Income Ages 25 - 44 years Correlation Chart
The statistical analysis conducted on geographies consisting of 435,952,621 people shows a slight negative correlation between the proportion of Canadians and household income with householder between the ages 25 and 44 in the United States with a correlation coefficient (R) of -0.053 and weighted average of $97,625. Similarly, the statistical analysis conducted on geographies consisting of 462,354,902 people shows a weak negative correlation between the proportion of Immigrants from Germany and household income with householder between the ages 25 and 44 in the United States with a correlation coefficient (R) of -0.294 and weighted average of $95,913, a difference of 1.8%.
Householder Income Ages 25 - 44 years Correlation Summary
| Measurement | Canadian | Immigrants from Germany |
| Minimum | $24,946 | $73,472 |
| Maximum | $162,133 | $129,121 |
| Range | $137,187 | $55,649 |
| Mean | $92,304 | $100,474 |
| Median | $88,643 | $101,592 |
| Interquartile 25% (IQ1) | $76,629 | $93,342 |
| Interquartile 75% (IQ3) | $111,424 | $107,107 |
| Interquartile Range (IQR) | $34,795 | $13,765 |
| Standard Deviation (Sample) | $29,698 | $15,097 |
| Standard Deviation (Population) | $29,162 | $14,715 |
Similar Demographics by Householder Income Ages 25 - 44 years
Demographics Similar to Canadians by Householder Income Ages 25 - 44 years
In terms of householder income ages 25 - 44 years, the demographic groups most similar to Canadians are Immigrants from Oceania ($97,623, a difference of 0.0%), Hungarian ($97,544, a difference of 0.080%), Tsimshian ($97,809, a difference of 0.19%), Immigrants from Zimbabwe ($97,880, a difference of 0.26%), and Lebanese ($97,339, a difference of 0.29%).
| Demographics | Rating | Rank | Householder Income Ages 25 - 44 years |
| Serbians | 88.9 /100 | #127 | Excellent $98,320 |
| Europeans | 88.9 /100 | #128 | Excellent $98,310 |
| Brazilians | 88.6 /100 | #129 | Excellent $98,267 |
| Immigrants | Kuwait | 87.8 /100 | #130 | Excellent $98,122 |
| Immigrants | Albania | 86.6 /100 | #131 | Excellent $97,929 |
| Immigrants | Zimbabwe | 86.3 /100 | #132 | Excellent $97,880 |
| Tsimshian | 85.8 /100 | #133 | Excellent $97,809 |
| Canadians | 84.5 /100 | #134 | Excellent $97,625 |
| Immigrants | Oceania | 84.5 /100 | #135 | Excellent $97,623 |
| Hungarians | 83.9 /100 | #136 | Excellent $97,544 |
| Lebanese | 82.3 /100 | #137 | Excellent $97,339 |
| Arabs | 82.3 /100 | #138 | Excellent $97,336 |
| Immigrants | Peru | 82.2 /100 | #139 | Excellent $97,329 |
| Immigrants | Morocco | 82.0 /100 | #140 | Excellent $97,305 |
| Luxembourgers | 81.5 /100 | #141 | Excellent $97,237 |
Demographics Similar to Immigrants from Germany by Householder Income Ages 25 - 44 years
In terms of householder income ages 25 - 44 years, the demographic groups most similar to Immigrants from Germany are Moroccan ($96,117, a difference of 0.21%), Immigrants from Uganda ($95,698, a difference of 0.22%), Scandinavian ($95,596, a difference of 0.33%), Costa Rican ($95,565, a difference of 0.36%), and Icelander ($95,560, a difference of 0.37%).
| Demographics | Rating | Rank | Householder Income Ages 25 - 44 years |
| Basques | 76.6 /100 | #149 | Good $96,709 |
| Ugandans | 76.2 /100 | #150 | Good $96,667 |
| Czechs | 74.8 /100 | #151 | Good $96,525 |
| South American Indians | 74.5 /100 | #152 | Good $96,497 |
| Slovenes | 73.9 /100 | #153 | Good $96,439 |
| Slavs | 73.2 /100 | #154 | Good $96,377 |
| Moroccans | 70.3 /100 | #155 | Good $96,117 |
| Immigrants | Germany | 67.9 /100 | #156 | Good $95,913 |
| Immigrants | Uganda | 65.2 /100 | #157 | Good $95,698 |
| Scandinavians | 63.9 /100 | #158 | Good $95,596 |
| Costa Ricans | 63.5 /100 | #159 | Good $95,565 |
| Icelanders | 63.4 /100 | #160 | Good $95,560 |
| Immigrants | Portugal | 62.8 /100 | #161 | Good $95,512 |
| Swiss | 62.8 /100 | #162 | Good $95,511 |
| Immigrants | Saudi Arabia | 62.0 /100 | #163 | Good $95,450 |