Immigrants from Middle Africa vs Sri Lankan Median Earnings
COMPARE
Immigrants from Middle Africa
Sri Lankan
Median Earnings
Median Earnings Comparison
Immigrants from Middle Africa
Sri Lankans
$43,416
MEDIAN EARNINGS
1.4/ 100
METRIC RATING
255th/ 347
METRIC RANK
$48,040
MEDIAN EARNINGS
90.5/ 100
METRIC RATING
134th/ 347
METRIC RANK
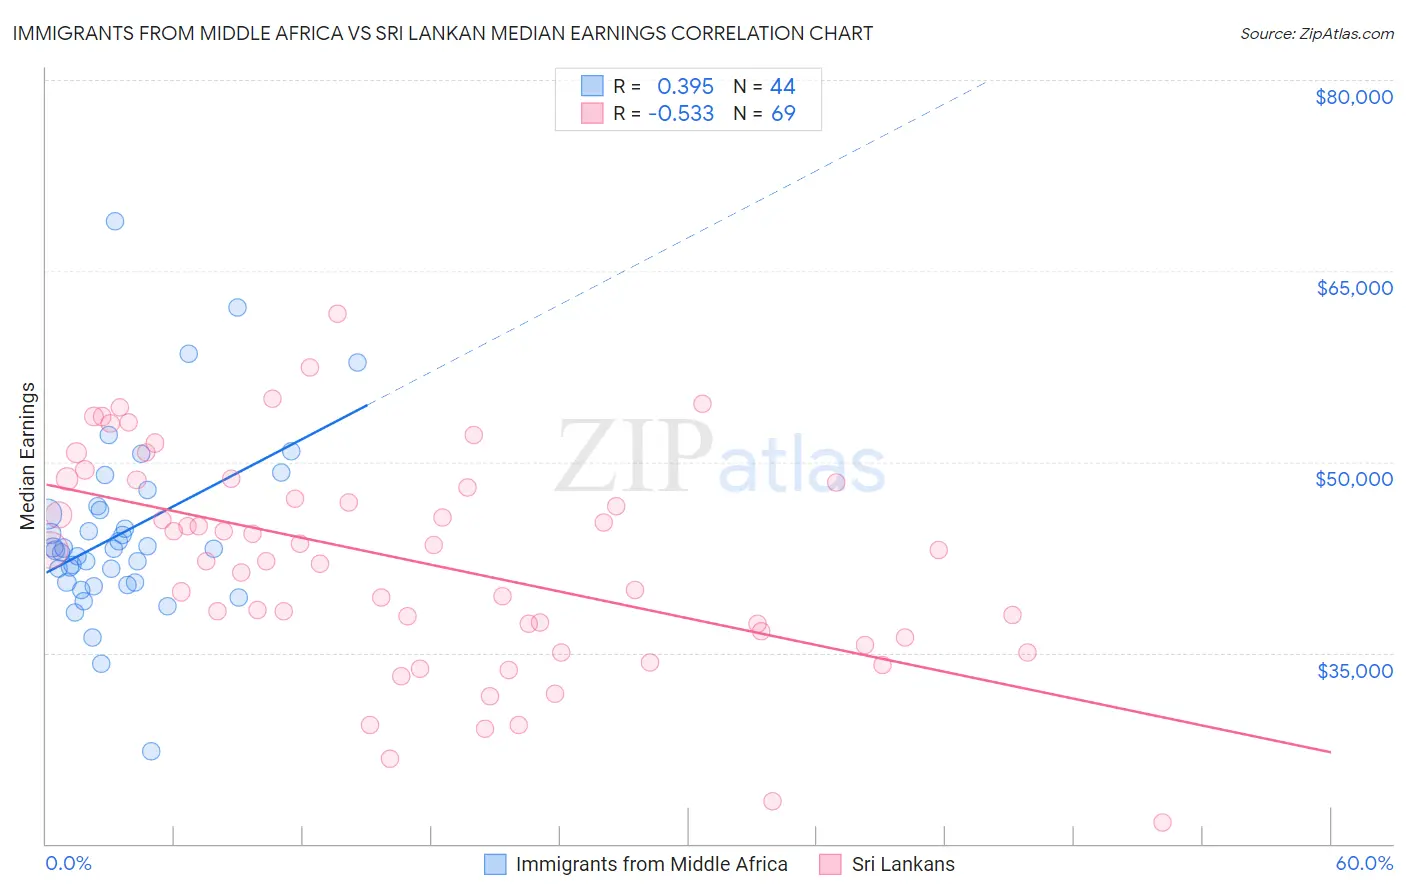
Immigrants from Middle Africa vs Sri Lankan Median Earnings Correlation Chart
The statistical analysis conducted on geographies consisting of 202,728,521 people shows a mild positive correlation between the proportion of Immigrants from Middle Africa and median earnings in the United States with a correlation coefficient (R) of 0.395 and weighted average of $43,416. Similarly, the statistical analysis conducted on geographies consisting of 440,583,083 people shows a substantial negative correlation between the proportion of Sri Lankans and median earnings in the United States with a correlation coefficient (R) of -0.533 and weighted average of $48,040, a difference of 10.6%.
Median Earnings Correlation Summary
| Measurement | Immigrants from Middle Africa | Sri Lankan |
| Minimum | $27,307 | $21,667 |
| Maximum | $68,894 | $61,651 |
| Range | $41,587 | $39,984 |
| Mean | $44,490 | $42,190 |
| Median | $43,158 | $43,063 |
| Interquartile 25% (IQ1) | $40,556 | $36,459 |
| Interquartile 75% (IQ3) | $46,358 | $48,491 |
| Interquartile Range (IQR) | $5,802 | $12,032 |
| Standard Deviation (Sample) | $7,197 | $8,385 |
| Standard Deviation (Population) | $7,115 | $8,324 |
Similar Demographics by Median Earnings
Demographics Similar to Immigrants from Middle Africa by Median Earnings
In terms of median earnings, the demographic groups most similar to Immigrants from Middle Africa are Alaskan Athabascan ($43,393, a difference of 0.050%), Jamaican ($43,343, a difference of 0.17%), French American Indian ($43,333, a difference of 0.19%), Liberian ($43,536, a difference of 0.28%), and Somali ($43,567, a difference of 0.35%).
| Demographics | Rating | Rank | Median Earnings |
| Nepalese | 2.6 /100 | #248 | Tragic $43,860 |
| Malaysians | 2.6 /100 | #249 | Tragic $43,844 |
| Alaska Natives | 2.3 /100 | #250 | Tragic $43,750 |
| Tsimshian | 2.1 /100 | #251 | Tragic $43,695 |
| Hawaiians | 2.0 /100 | #252 | Tragic $43,673 |
| Somalis | 1.8 /100 | #253 | Tragic $43,567 |
| Liberians | 1.7 /100 | #254 | Tragic $43,536 |
| Immigrants | Middle Africa | 1.4 /100 | #255 | Tragic $43,416 |
| Alaskan Athabascans | 1.4 /100 | #256 | Tragic $43,393 |
| Jamaicans | 1.3 /100 | #257 | Tragic $43,343 |
| French American Indians | 1.3 /100 | #258 | Tragic $43,333 |
| German Russians | 1.1 /100 | #259 | Tragic $43,200 |
| Immigrants | Somalia | 0.9 /100 | #260 | Tragic $43,100 |
| Immigrants | Jamaica | 0.8 /100 | #261 | Tragic $43,026 |
| Nicaraguans | 0.8 /100 | #262 | Tragic $43,026 |
Demographics Similar to Sri Lankans by Median Earnings
In terms of median earnings, the demographic groups most similar to Sri Lankans are Immigrants from Uganda ($48,041, a difference of 0.0%), Portuguese ($48,032, a difference of 0.020%), Slovene ($47,995, a difference of 0.090%), Immigrants from Nepal ($47,925, a difference of 0.24%), and European ($47,915, a difference of 0.26%).
| Demographics | Rating | Rank | Median Earnings |
| Sierra Leoneans | 93.1 /100 | #127 | Exceptional $48,286 |
| Immigrants | Philippines | 92.9 /100 | #128 | Exceptional $48,266 |
| Pakistanis | 92.8 /100 | #129 | Exceptional $48,254 |
| Zimbabweans | 92.6 /100 | #130 | Exceptional $48,229 |
| Lebanese | 92.5 /100 | #131 | Exceptional $48,226 |
| British | 92.2 /100 | #132 | Exceptional $48,189 |
| Immigrants | Uganda | 90.5 /100 | #133 | Exceptional $48,041 |
| Sri Lankans | 90.5 /100 | #134 | Exceptional $48,040 |
| Portuguese | 90.4 /100 | #135 | Exceptional $48,032 |
| Slovenes | 90.0 /100 | #136 | Excellent $47,995 |
| Immigrants | Nepal | 89.0 /100 | #137 | Excellent $47,925 |
| Europeans | 88.9 /100 | #138 | Excellent $47,915 |
| Canadians | 88.8 /100 | #139 | Excellent $47,911 |
| Taiwanese | 88.7 /100 | #140 | Excellent $47,902 |
| Immigrants | Sierra Leone | 88.3 /100 | #141 | Excellent $47,875 |