Immigrants from Lithuania vs Aleut Median Household Income
COMPARE
Immigrants from Lithuania
Aleut
Median Household Income
Median Household Income Comparison
Immigrants from Lithuania
Aleuts
$96,836
MEDIAN HOUSEHOLD INCOME
99.9/ 100
METRIC RATING
42nd/ 347
METRIC RANK
$83,446
MEDIAN HOUSEHOLD INCOME
25.7/ 100
METRIC RATING
197th/ 347
METRIC RANK
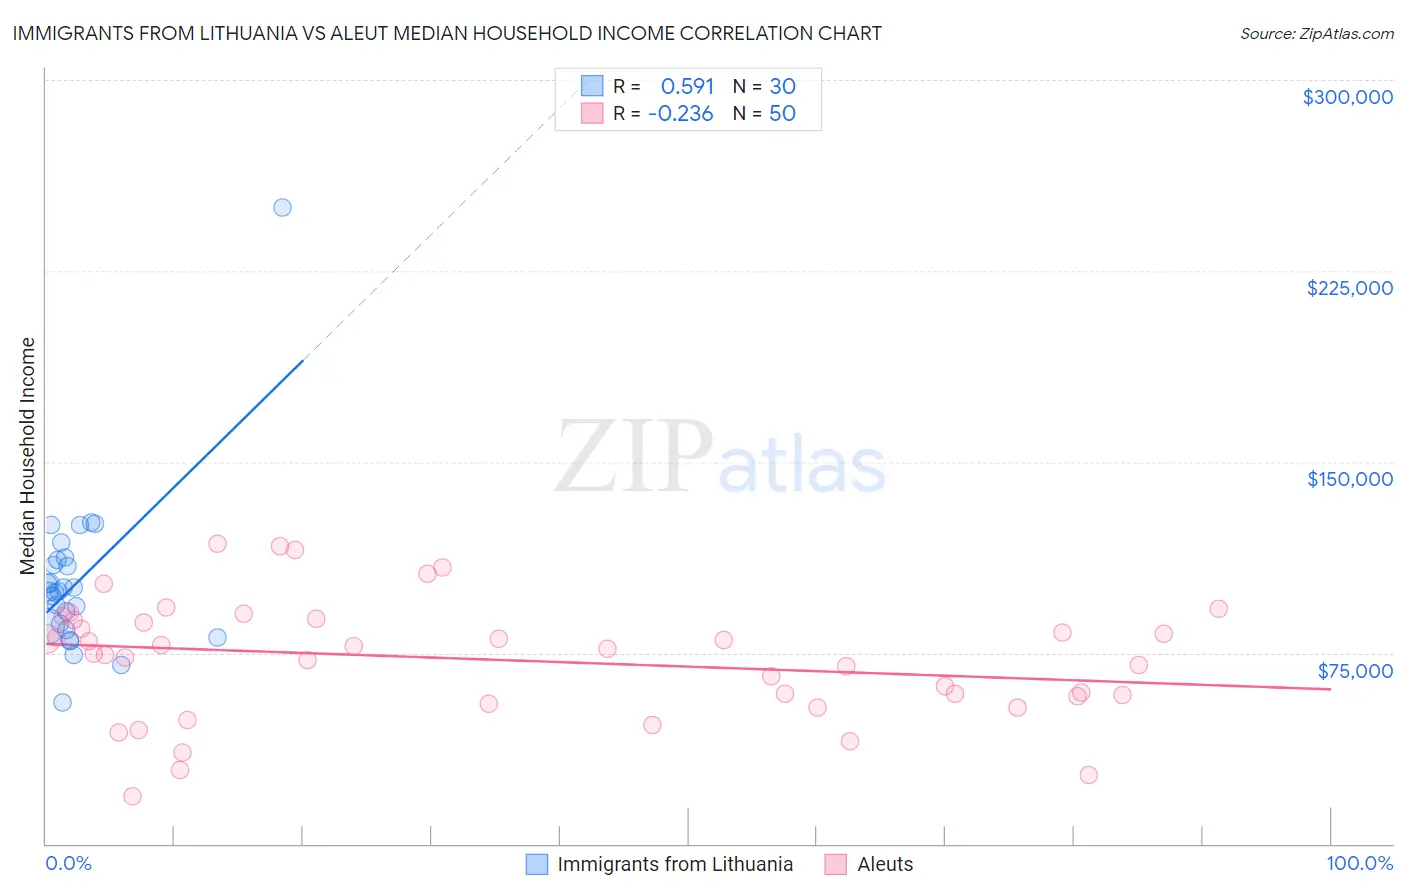
Immigrants from Lithuania vs Aleut Median Household Income Correlation Chart
The statistical analysis conducted on geographies consisting of 117,713,976 people shows a substantial positive correlation between the proportion of Immigrants from Lithuania and median household income in the United States with a correlation coefficient (R) of 0.591 and weighted average of $96,836. Similarly, the statistical analysis conducted on geographies consisting of 61,772,916 people shows a weak negative correlation between the proportion of Aleuts and median household income in the United States with a correlation coefficient (R) of -0.236 and weighted average of $83,446, a difference of 16.1%.
Median Household Income Correlation Summary
| Measurement | Immigrants from Lithuania | Aleut |
| Minimum | $55,636 | $18,750 |
| Maximum | $250,001 | $117,969 |
| Range | $194,365 | $99,219 |
| Mean | $102,979 | $72,433 |
| Median | $99,018 | $75,755 |
| Interquartile 25% (IQ1) | $85,668 | $58,000 |
| Interquartile 75% (IQ3) | $111,586 | $87,683 |
| Interquartile Range (IQR) | $25,918 | $29,683 |
| Standard Deviation (Sample) | $32,780 | $23,307 |
| Standard Deviation (Population) | $32,229 | $23,073 |
Similar Demographics by Median Household Income
Demographics Similar to Immigrants from Lithuania by Median Household Income
In terms of median household income, the demographic groups most similar to Immigrants from Lithuania are Immigrants from France ($96,743, a difference of 0.10%), Immigrants from Turkey ($96,964, a difference of 0.13%), Immigrants from Greece ($96,675, a difference of 0.17%), Maltese ($97,015, a difference of 0.18%), and Afghan ($97,026, a difference of 0.20%).
| Demographics | Rating | Rank | Median Household Income |
| Immigrants | Switzerland | 100.0 /100 | #35 | Exceptional $97,979 |
| Immigrants | Pakistan | 100.0 /100 | #36 | Exceptional $97,528 |
| Latvians | 100.0 /100 | #37 | Exceptional $97,311 |
| Immigrants | Indonesia | 100.0 /100 | #38 | Exceptional $97,297 |
| Afghans | 100.0 /100 | #39 | Exceptional $97,026 |
| Maltese | 100.0 /100 | #40 | Exceptional $97,015 |
| Immigrants | Turkey | 100.0 /100 | #41 | Exceptional $96,964 |
| Immigrants | Lithuania | 99.9 /100 | #42 | Exceptional $96,836 |
| Immigrants | France | 99.9 /100 | #43 | Exceptional $96,743 |
| Immigrants | Greece | 99.9 /100 | #44 | Exceptional $96,675 |
| Israelis | 99.9 /100 | #45 | Exceptional $96,552 |
| Australians | 99.9 /100 | #46 | Exceptional $96,490 |
| Immigrants | Russia | 99.9 /100 | #47 | Exceptional $96,378 |
| Cambodians | 99.9 /100 | #48 | Exceptional $96,324 |
| Immigrants | Malaysia | 99.9 /100 | #49 | Exceptional $96,292 |
Demographics Similar to Aleuts by Median Household Income
In terms of median household income, the demographic groups most similar to Aleuts are French ($83,468, a difference of 0.030%), Japanese ($83,395, a difference of 0.060%), German ($83,358, a difference of 0.11%), Tsimshian ($83,346, a difference of 0.12%), and Spanish ($83,343, a difference of 0.12%).
| Demographics | Rating | Rank | Median Household Income |
| Slovaks | 30.2 /100 | #190 | Fair $83,798 |
| Iraqis | 29.6 /100 | #191 | Fair $83,753 |
| Welsh | 28.0 /100 | #192 | Fair $83,628 |
| Finns | 27.7 /100 | #193 | Fair $83,607 |
| Ghanaians | 27.4 /100 | #194 | Fair $83,582 |
| Immigrants | Armenia | 27.0 /100 | #195 | Fair $83,555 |
| French | 26.0 /100 | #196 | Fair $83,468 |
| Aleuts | 25.7 /100 | #197 | Fair $83,446 |
| Japanese | 25.1 /100 | #198 | Fair $83,395 |
| Germans | 24.6 /100 | #199 | Fair $83,358 |
| Tsimshian | 24.5 /100 | #200 | Fair $83,346 |
| Spanish | 24.4 /100 | #201 | Fair $83,343 |
| Immigrants | Thailand | 24.3 /100 | #202 | Fair $83,327 |
| Immigrants | Cambodia | 24.0 /100 | #203 | Fair $83,304 |
| Immigrants | Africa | 23.8 /100 | #204 | Fair $83,289 |