Immigrants from Lithuania vs Immigrants from Belize Per Capita Income
COMPARE
Immigrants from Lithuania
Immigrants from Belize
Per Capita Income
Per Capita Income Comparison
Immigrants from Lithuania
Immigrants from Belize
$51,361
PER CAPITA INCOME
100.0/ 100
METRIC RATING
43rd/ 347
METRIC RANK
$38,614
PER CAPITA INCOME
0.3/ 100
METRIC RATING
270th/ 347
METRIC RANK
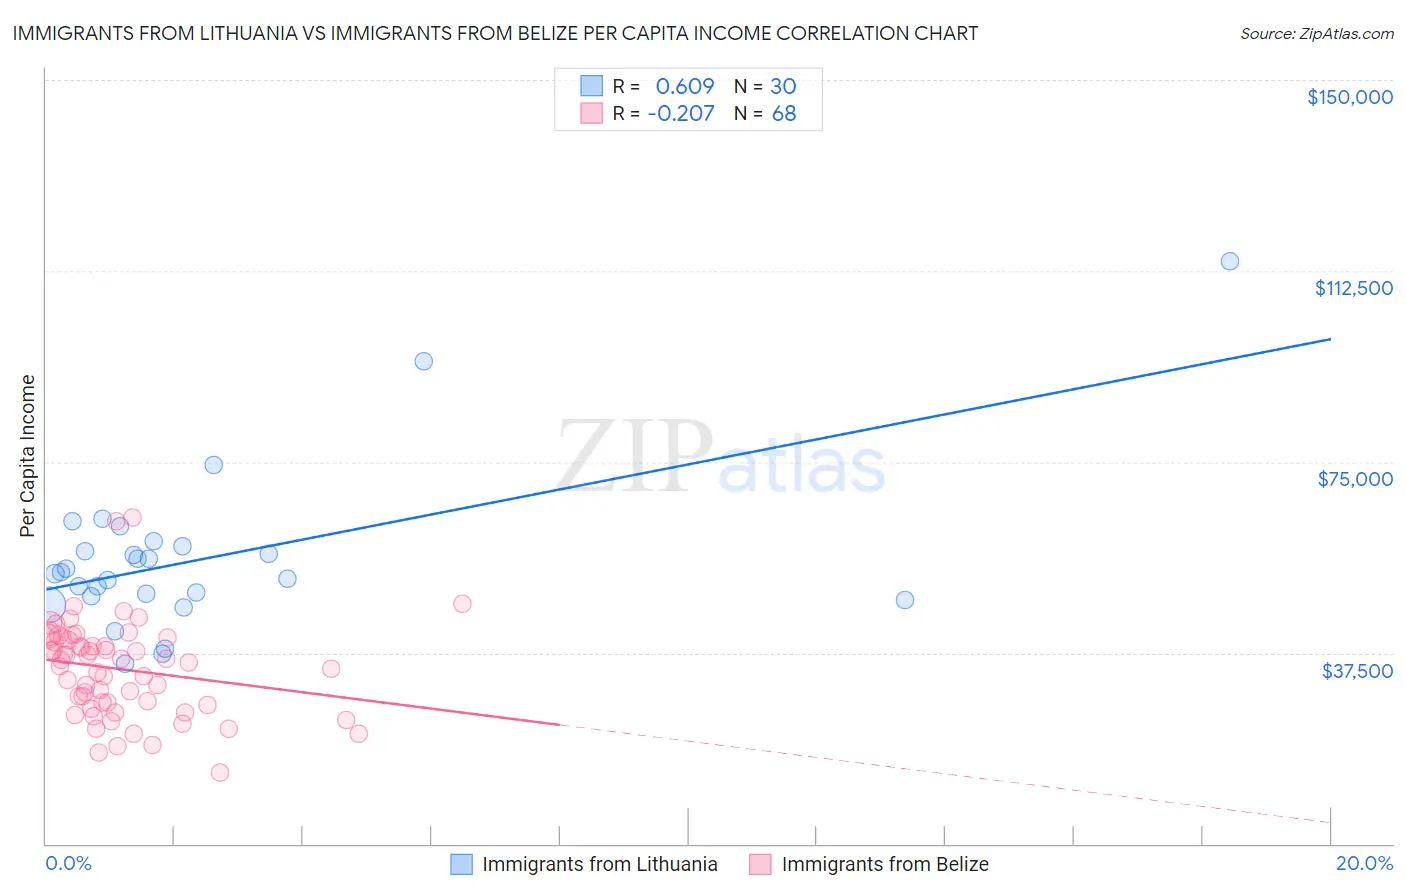
Immigrants from Lithuania vs Immigrants from Belize Per Capita Income Correlation Chart
The statistical analysis conducted on geographies consisting of 117,724,932 people shows a significant positive correlation between the proportion of Immigrants from Lithuania and per capita income in the United States with a correlation coefficient (R) of 0.609 and weighted average of $51,361. Similarly, the statistical analysis conducted on geographies consisting of 130,314,146 people shows a weak negative correlation between the proportion of Immigrants from Belize and per capita income in the United States with a correlation coefficient (R) of -0.207 and weighted average of $38,614, a difference of 33.0%.
Per Capita Income Correlation Summary
| Measurement | Immigrants from Lithuania | Immigrants from Belize |
| Minimum | $35,413 | $13,974 |
| Maximum | $114,327 | $63,996 |
| Range | $78,914 | $50,022 |
| Mean | $56,005 | $34,271 |
| Median | $53,196 | $35,906 |
| Interquartile 25% (IQ1) | $48,580 | $27,515 |
| Interquartile 75% (IQ3) | $58,433 | $40,202 |
| Interquartile Range (IQR) | $9,853 | $12,687 |
| Standard Deviation (Sample) | $15,760 | $9,371 |
| Standard Deviation (Population) | $15,495 | $9,302 |
Similar Demographics by Per Capita Income
Demographics Similar to Immigrants from Lithuania by Per Capita Income
In terms of per capita income, the demographic groups most similar to Immigrants from Lithuania are Immigrants from Turkey ($51,368, a difference of 0.010%), Immigrants from South Africa ($51,465, a difference of 0.20%), Immigrants from Korea ($51,671, a difference of 0.60%), Cambodian ($51,731, a difference of 0.72%), and Immigrants from Czechoslovakia ($51,770, a difference of 0.80%).
| Demographics | Rating | Rank | Per Capita Income |
| Immigrants | Greece | 100.0 /100 | #36 | Exceptional $51,891 |
| Estonians | 100.0 /100 | #37 | Exceptional $51,875 |
| Immigrants | Czechoslovakia | 100.0 /100 | #38 | Exceptional $51,770 |
| Cambodians | 100.0 /100 | #39 | Exceptional $51,731 |
| Immigrants | Korea | 100.0 /100 | #40 | Exceptional $51,671 |
| Immigrants | South Africa | 100.0 /100 | #41 | Exceptional $51,465 |
| Immigrants | Turkey | 100.0 /100 | #42 | Exceptional $51,368 |
| Immigrants | Lithuania | 100.0 /100 | #43 | Exceptional $51,361 |
| Immigrants | Europe | 100.0 /100 | #44 | Exceptional $50,950 |
| Immigrants | Spain | 100.0 /100 | #45 | Exceptional $50,933 |
| Immigrants | Latvia | 100.0 /100 | #46 | Exceptional $50,914 |
| Bulgarians | 100.0 /100 | #47 | Exceptional $50,906 |
| Immigrants | Serbia | 100.0 /100 | #48 | Exceptional $50,810 |
| New Zealanders | 100.0 /100 | #49 | Exceptional $50,575 |
| Immigrants | Sri Lanka | 100.0 /100 | #50 | Exceptional $50,555 |
Demographics Similar to Immigrants from Belize by Per Capita Income
In terms of per capita income, the demographic groups most similar to Immigrants from Belize are Central American ($38,560, a difference of 0.14%), Immigrants from Cabo Verde ($38,540, a difference of 0.19%), Immigrants from Jamaica ($38,766, a difference of 0.39%), Liberian ($38,780, a difference of 0.43%), and Nepalese ($38,442, a difference of 0.45%).
| Demographics | Rating | Rank | Per Capita Income |
| Belizeans | 0.6 /100 | #263 | Tragic $39,097 |
| Americans | 0.6 /100 | #264 | Tragic $39,039 |
| Spanish Americans | 0.5 /100 | #265 | Tragic $39,012 |
| Salvadorans | 0.5 /100 | #266 | Tragic $38,858 |
| Immigrants | Zaire | 0.4 /100 | #267 | Tragic $38,848 |
| Liberians | 0.4 /100 | #268 | Tragic $38,780 |
| Immigrants | Jamaica | 0.4 /100 | #269 | Tragic $38,766 |
| Immigrants | Belize | 0.3 /100 | #270 | Tragic $38,614 |
| Central Americans | 0.3 /100 | #271 | Tragic $38,560 |
| Immigrants | Cabo Verde | 0.3 /100 | #272 | Tragic $38,540 |
| Nepalese | 0.3 /100 | #273 | Tragic $38,442 |
| Immigrants | El Salvador | 0.3 /100 | #274 | Tragic $38,394 |
| Immigrants | Liberia | 0.2 /100 | #275 | Tragic $38,165 |
| Hmong | 0.2 /100 | #276 | Tragic $38,120 |
| Comanche | 0.2 /100 | #277 | Tragic $38,088 |