Bhutanese vs Ute Per Capita Income
COMPARE
Bhutanese
Ute
Per Capita Income
Per Capita Income Comparison
Bhutanese
Ute
$49,894
PER CAPITA INCOME
99.9/ 100
METRIC RATING
59th/ 347
METRIC RANK
$36,651
PER CAPITA INCOME
0.0/ 100
METRIC RATING
310th/ 347
METRIC RANK
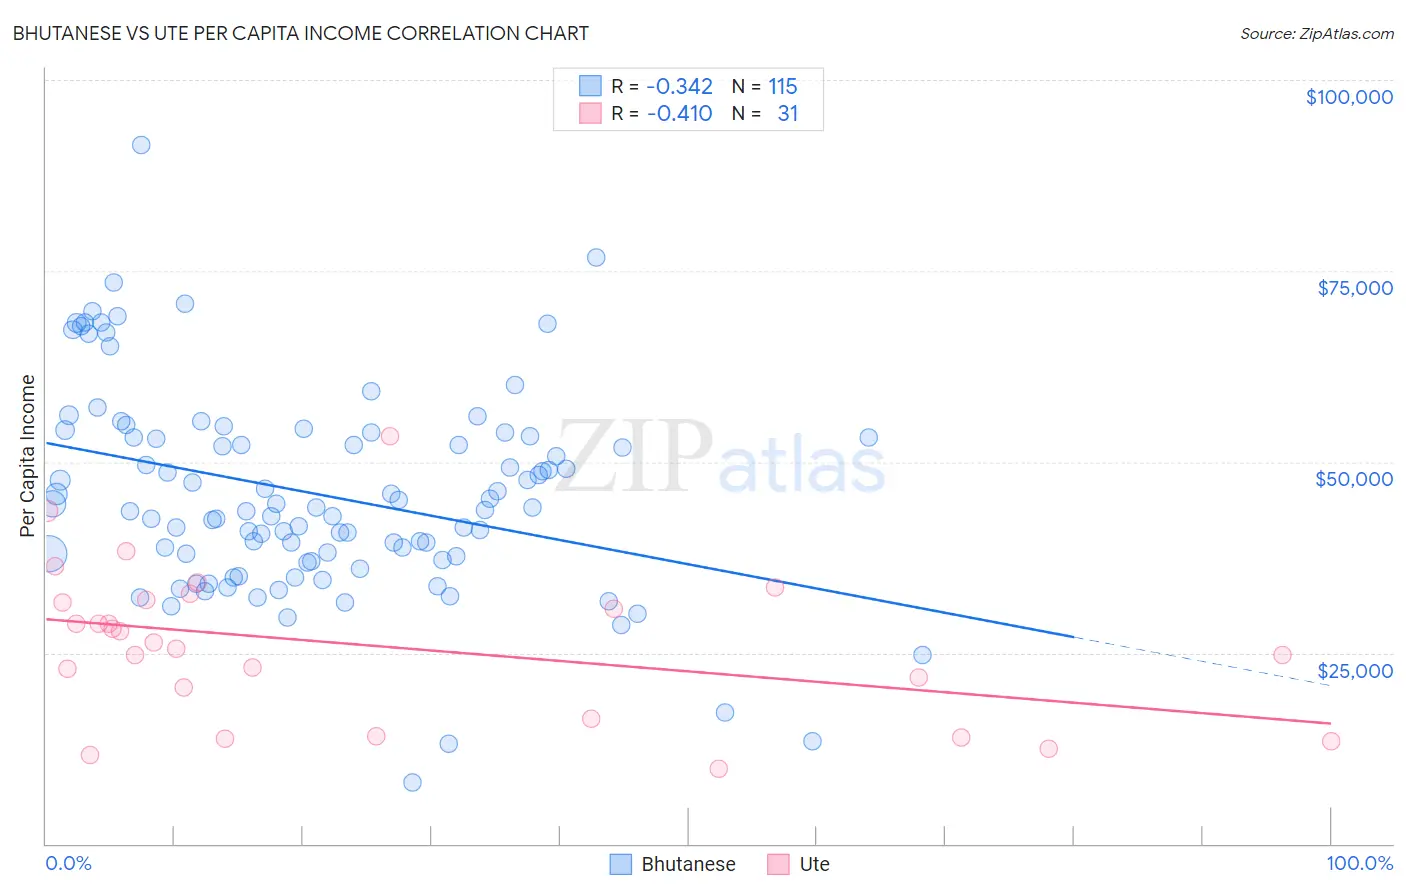
Bhutanese vs Ute Per Capita Income Correlation Chart
The statistical analysis conducted on geographies consisting of 455,599,247 people shows a mild negative correlation between the proportion of Bhutanese and per capita income in the United States with a correlation coefficient (R) of -0.342 and weighted average of $49,894. Similarly, the statistical analysis conducted on geographies consisting of 55,660,141 people shows a moderate negative correlation between the proportion of Ute and per capita income in the United States with a correlation coefficient (R) of -0.410 and weighted average of $36,651, a difference of 36.1%.
Per Capita Income Correlation Summary
| Measurement | Bhutanese | Ute |
| Minimum | $8,097 | $9,749 |
| Maximum | $91,569 | $53,279 |
| Range | $83,472 | $43,530 |
| Mean | $45,753 | $25,907 |
| Median | $44,077 | $26,299 |
| Interquartile 25% (IQ1) | $37,217 | $16,307 |
| Interquartile 75% (IQ3) | $53,334 | $31,910 |
| Interquartile Range (IQR) | $16,117 | $15,603 |
| Standard Deviation (Sample) | $13,593 | $10,024 |
| Standard Deviation (Population) | $13,533 | $9,861 |
Similar Demographics by Per Capita Income
Demographics Similar to Bhutanese by Per Capita Income
In terms of per capita income, the demographic groups most similar to Bhutanese are Immigrants from Scotland ($49,893, a difference of 0.0%), Argentinean ($49,862, a difference of 0.070%), Immigrants from Malaysia ($49,983, a difference of 0.18%), South African ($50,044, a difference of 0.30%), and Immigrants from Asia ($49,741, a difference of 0.31%).
| Demographics | Rating | Rank | Per Capita Income |
| Immigrants | Croatia | 99.9 /100 | #52 | Exceptional $50,417 |
| Paraguayans | 99.9 /100 | #53 | Exceptional $50,385 |
| Immigrants | Belarus | 99.9 /100 | #54 | Exceptional $50,303 |
| Immigrants | Western Europe | 99.9 /100 | #55 | Exceptional $50,065 |
| Asians | 99.9 /100 | #56 | Exceptional $50,057 |
| South Africans | 99.9 /100 | #57 | Exceptional $50,044 |
| Immigrants | Malaysia | 99.9 /100 | #58 | Exceptional $49,983 |
| Bhutanese | 99.9 /100 | #59 | Exceptional $49,894 |
| Immigrants | Scotland | 99.9 /100 | #60 | Exceptional $49,893 |
| Argentineans | 99.9 /100 | #61 | Exceptional $49,862 |
| Immigrants | Asia | 99.9 /100 | #62 | Exceptional $49,741 |
| Maltese | 99.9 /100 | #63 | Exceptional $49,640 |
| Immigrants | Argentina | 99.9 /100 | #64 | Exceptional $49,627 |
| Bolivians | 99.9 /100 | #65 | Exceptional $49,526 |
| Immigrants | Bulgaria | 99.9 /100 | #66 | Exceptional $49,482 |
Demographics Similar to Ute by Per Capita Income
In terms of per capita income, the demographic groups most similar to Ute are Immigrants from Honduras ($36,665, a difference of 0.040%), Chippewa ($36,631, a difference of 0.060%), Fijian ($36,690, a difference of 0.10%), Immigrants from Latin America ($36,823, a difference of 0.47%), and Chickasaw ($36,475, a difference of 0.48%).
| Demographics | Rating | Rank | Per Capita Income |
| Paiute | 0.1 /100 | #303 | Tragic $37,066 |
| Hondurans | 0.1 /100 | #304 | Tragic $37,031 |
| Inupiat | 0.1 /100 | #305 | Tragic $36,999 |
| Immigrants | Haiti | 0.0 /100 | #306 | Tragic $36,849 |
| Immigrants | Latin America | 0.0 /100 | #307 | Tragic $36,823 |
| Fijians | 0.0 /100 | #308 | Tragic $36,690 |
| Immigrants | Honduras | 0.0 /100 | #309 | Tragic $36,665 |
| Ute | 0.0 /100 | #310 | Tragic $36,651 |
| Chippewa | 0.0 /100 | #311 | Tragic $36,631 |
| Chickasaw | 0.0 /100 | #312 | Tragic $36,475 |
| Bahamians | 0.0 /100 | #313 | Tragic $36,427 |
| Seminole | 0.0 /100 | #314 | Tragic $36,180 |
| Yaqui | 0.0 /100 | #315 | Tragic $36,112 |
| Choctaw | 0.0 /100 | #316 | Tragic $35,999 |
| Dutch West Indians | 0.0 /100 | #317 | Tragic $35,922 |