Immigrants from Liberia vs Israeli Householder Income Ages 25 - 44 years
COMPARE
Immigrants from Liberia
Israeli
Householder Income Ages 25 - 44 years
Householder Income Ages 25 - 44 years Comparison
Immigrants from Liberia
Israelis
$80,863
HOUSEHOLDER INCOME AGES 25 - 44 YEARS
0.1/ 100
METRIC RATING
299th/ 347
METRIC RANK
$107,579
HOUSEHOLDER INCOME AGES 25 - 44 YEARS
99.9/ 100
METRIC RATING
45th/ 347
METRIC RANK
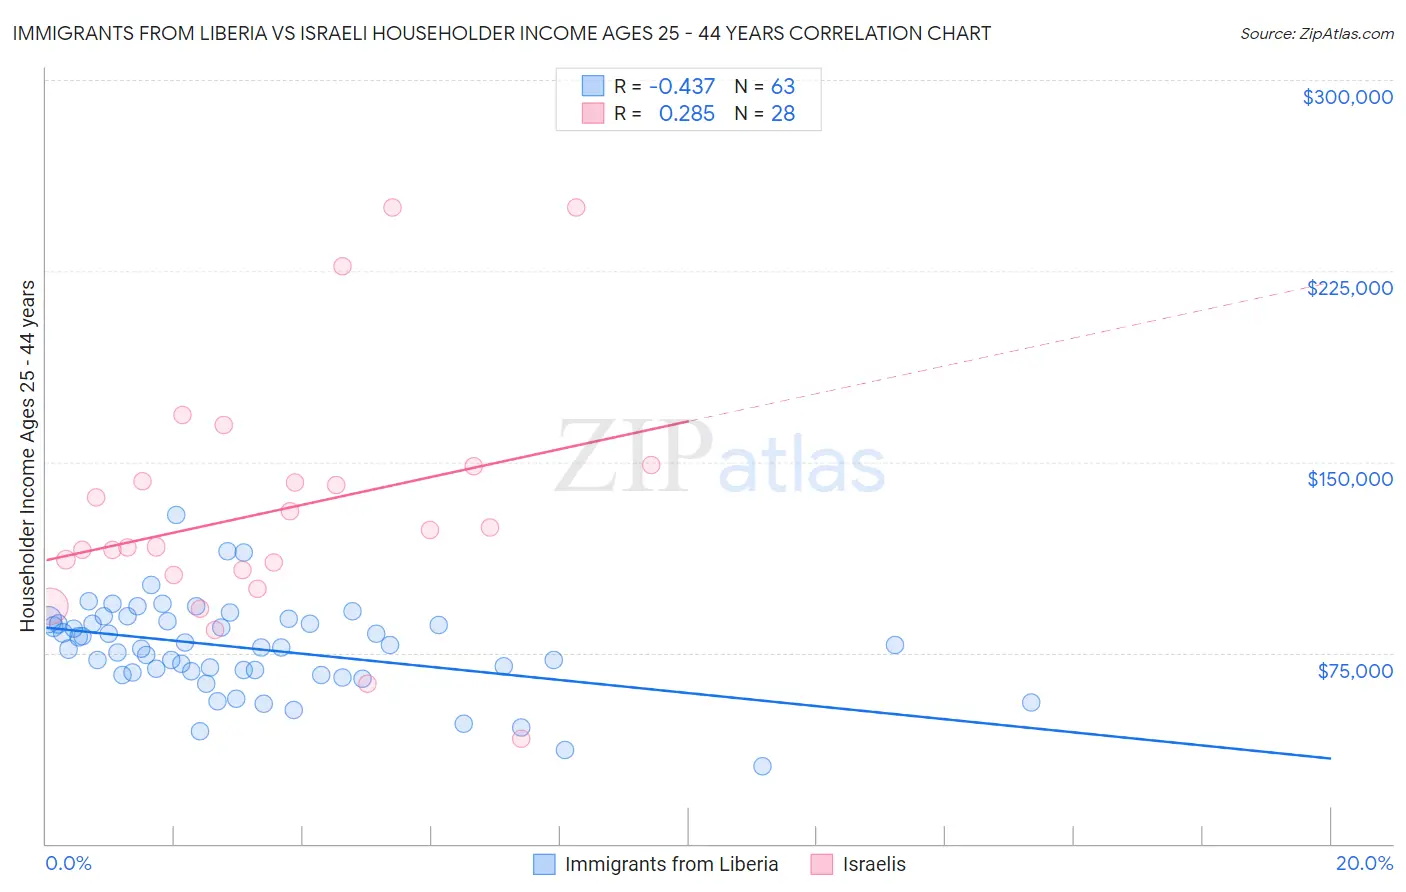
Immigrants from Liberia vs Israeli Householder Income Ages 25 - 44 years Correlation Chart
The statistical analysis conducted on geographies consisting of 135,196,849 people shows a moderate negative correlation between the proportion of Immigrants from Liberia and household income with householder between the ages 25 and 44 in the United States with a correlation coefficient (R) of -0.437 and weighted average of $80,863. Similarly, the statistical analysis conducted on geographies consisting of 210,632,541 people shows a weak positive correlation between the proportion of Israelis and household income with householder between the ages 25 and 44 in the United States with a correlation coefficient (R) of 0.285 and weighted average of $107,579, a difference of 33.0%.
Householder Income Ages 25 - 44 years Correlation Summary
| Measurement | Immigrants from Liberia | Israeli |
| Minimum | $30,517 | $41,080 |
| Maximum | $129,042 | $250,001 |
| Range | $98,525 | $208,921 |
| Mean | $76,665 | $131,021 |
| Median | $77,079 | $119,912 |
| Interquartile 25% (IQ1) | $67,377 | $106,515 |
| Interquartile 75% (IQ3) | $87,370 | $145,332 |
| Interquartile Range (IQR) | $19,994 | $38,818 |
| Standard Deviation (Sample) | $17,857 | $48,252 |
| Standard Deviation (Population) | $17,715 | $47,383 |
Similar Demographics by Householder Income Ages 25 - 44 years
Demographics Similar to Immigrants from Liberia by Householder Income Ages 25 - 44 years
In terms of householder income ages 25 - 44 years, the demographic groups most similar to Immigrants from Liberia are Cherokee ($80,843, a difference of 0.020%), Immigrants from Micronesia ($80,544, a difference of 0.40%), Hispanic or Latino ($80,515, a difference of 0.43%), Dominican ($81,229, a difference of 0.45%), and Mexican ($80,427, a difference of 0.54%).
| Demographics | Rating | Rank | Householder Income Ages 25 - 44 years |
| Yaqui | 0.1 /100 | #292 | Tragic $81,656 |
| Blackfeet | 0.1 /100 | #293 | Tragic $81,531 |
| Cubans | 0.1 /100 | #294 | Tragic $81,483 |
| Bangladeshis | 0.1 /100 | #295 | Tragic $81,363 |
| Immigrants | Dominica | 0.1 /100 | #296 | Tragic $81,351 |
| Immigrants | Guatemala | 0.1 /100 | #297 | Tragic $81,341 |
| Dominicans | 0.1 /100 | #298 | Tragic $81,229 |
| Immigrants | Liberia | 0.1 /100 | #299 | Tragic $80,863 |
| Cherokee | 0.0 /100 | #300 | Tragic $80,843 |
| Immigrants | Micronesia | 0.0 /100 | #301 | Tragic $80,544 |
| Hispanics or Latinos | 0.0 /100 | #302 | Tragic $80,515 |
| Mexicans | 0.0 /100 | #303 | Tragic $80,427 |
| Immigrants | Caribbean | 0.0 /100 | #304 | Tragic $80,326 |
| Immigrants | Dominican Republic | 0.0 /100 | #305 | Tragic $80,319 |
| Apache | 0.0 /100 | #306 | Tragic $80,260 |
Demographics Similar to Israelis by Householder Income Ages 25 - 44 years
In terms of householder income ages 25 - 44 years, the demographic groups most similar to Israelis are Immigrants from Indonesia ($107,627, a difference of 0.040%), Immigrants from Malaysia ($107,650, a difference of 0.070%), Immigrants from Belarus ($107,393, a difference of 0.17%), Estonian ($107,269, a difference of 0.29%), and Bulgarian ($107,264, a difference of 0.29%).
| Demographics | Rating | Rank | Householder Income Ages 25 - 44 years |
| Soviet Union | 100.0 /100 | #38 | Exceptional $108,457 |
| Immigrants | France | 99.9 /100 | #39 | Exceptional $108,257 |
| Immigrants | Lithuania | 99.9 /100 | #40 | Exceptional $108,149 |
| Immigrants | Bolivia | 99.9 /100 | #41 | Exceptional $108,128 |
| Australians | 99.9 /100 | #42 | Exceptional $107,912 |
| Immigrants | Malaysia | 99.9 /100 | #43 | Exceptional $107,650 |
| Immigrants | Indonesia | 99.9 /100 | #44 | Exceptional $107,627 |
| Israelis | 99.9 /100 | #45 | Exceptional $107,579 |
| Immigrants | Belarus | 99.9 /100 | #46 | Exceptional $107,393 |
| Estonians | 99.9 /100 | #47 | Exceptional $107,269 |
| Bulgarians | 99.9 /100 | #48 | Exceptional $107,264 |
| Immigrants | Turkey | 99.9 /100 | #49 | Exceptional $107,258 |
| Cambodians | 99.9 /100 | #50 | Exceptional $107,148 |
| Immigrants | Czechoslovakia | 99.9 /100 | #51 | Exceptional $106,888 |
| Immigrants | Europe | 99.9 /100 | #52 | Exceptional $106,817 |