Immigrants from Liberia vs Israeli In Labor Force | Age 25-29
COMPARE
Immigrants from Liberia
Israeli
In Labor Force | Age 25-29
In Labor Force | Age 25-29 Comparison
Immigrants from Liberia
Israelis
85.9%
IN LABOR FORCE | AGE 25-29
100.0/ 100
METRIC RATING
29th/ 347
METRIC RANK
84.3%
IN LABOR FORCE | AGE 25-29
9.3/ 100
METRIC RATING
216th/ 347
METRIC RANK
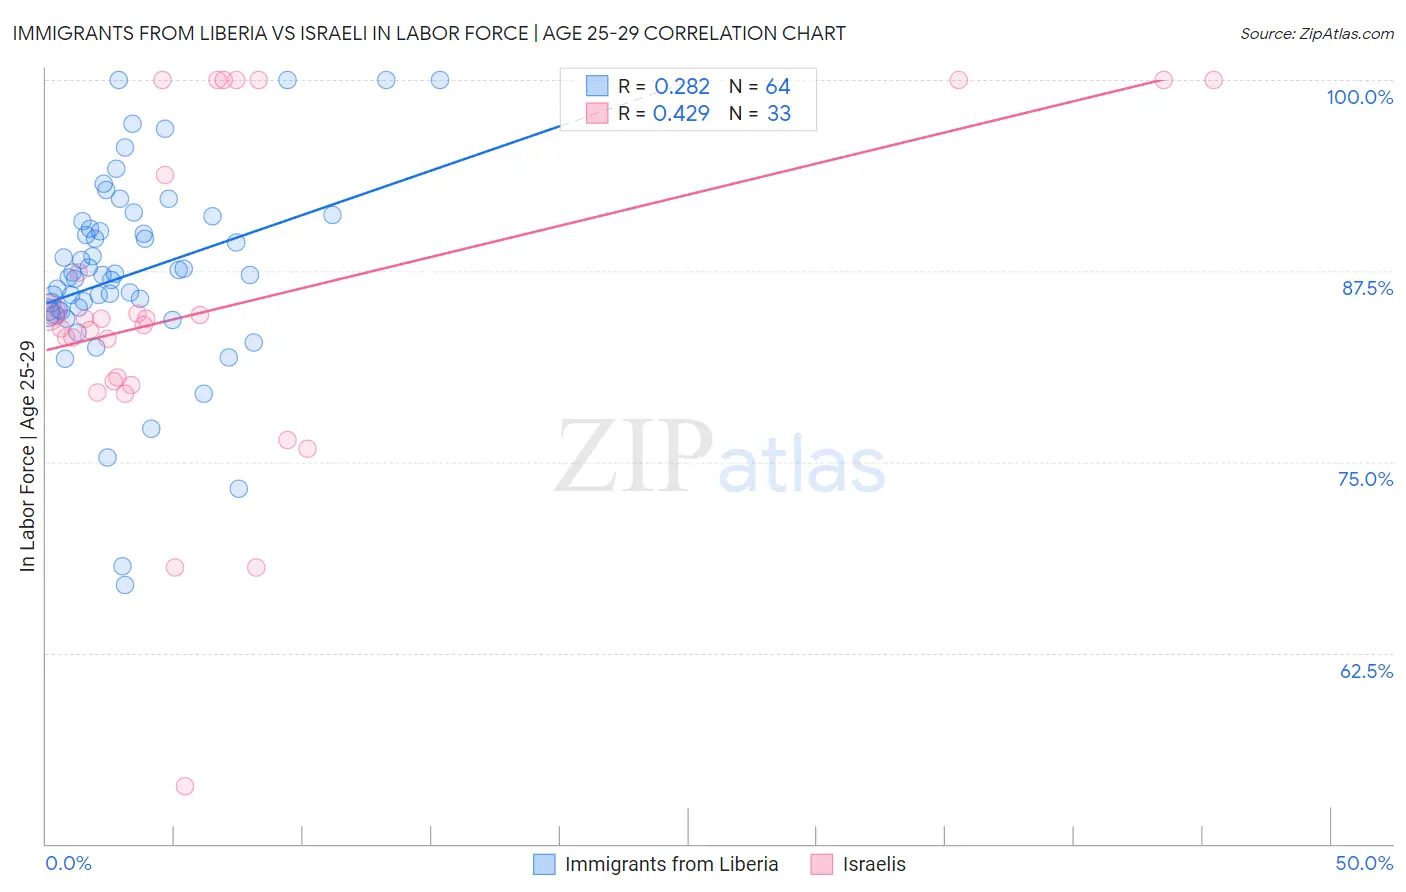
Immigrants from Liberia vs Israeli In Labor Force | Age 25-29 Correlation Chart
The statistical analysis conducted on geographies consisting of 135,263,214 people shows a weak positive correlation between the proportion of Immigrants from Liberia and labor force participation rate among population between the ages 25 and 29 in the United States with a correlation coefficient (R) of 0.282 and weighted average of 85.9%. Similarly, the statistical analysis conducted on geographies consisting of 211,154,320 people shows a moderate positive correlation between the proportion of Israelis and labor force participation rate among population between the ages 25 and 29 in the United States with a correlation coefficient (R) of 0.429 and weighted average of 84.3%, a difference of 1.9%.
In Labor Force | Age 25-29 Correlation Summary
| Measurement | Immigrants from Liberia | Israeli |
| Minimum | 66.9% | 53.8% |
| Maximum | 100.0% | 100.0% |
| Range | 33.1% | 46.2% |
| Mean | 87.3% | 85.3% |
| Median | 87.2% | 84.3% |
| Interquartile 25% (IQ1) | 84.9% | 80.1% |
| Interquartile 75% (IQ3) | 90.5% | 96.9% |
| Interquartile Range (IQR) | 5.6% | 16.8% |
| Standard Deviation (Sample) | 6.5% | 10.8% |
| Standard Deviation (Population) | 6.4% | 10.6% |
Similar Demographics by In Labor Force | Age 25-29
Demographics Similar to Immigrants from Liberia by In Labor Force | Age 25-29
In terms of in labor force | age 25-29, the demographic groups most similar to Immigrants from Liberia are Ugandan (85.9%, a difference of 0.0%), Paraguayan (85.9%, a difference of 0.010%), Immigrants from North Macedonia (85.9%, a difference of 0.020%), Immigrants from Serbia (85.9%, a difference of 0.040%), and German Russian (85.8%, a difference of 0.050%).
| Demographics | Rating | Rank | In Labor Force | Age 25-29 |
| Cambodians | 100.0 /100 | #22 | Exceptional 86.0% |
| Immigrants | Uganda | 100.0 /100 | #23 | Exceptional 86.0% |
| Immigrants | Eastern Africa | 100.0 /100 | #24 | Exceptional 86.0% |
| Sudanese | 100.0 /100 | #25 | Exceptional 85.9% |
| Immigrants | North Macedonia | 100.0 /100 | #26 | Exceptional 85.9% |
| Paraguayans | 100.0 /100 | #27 | Exceptional 85.9% |
| Ugandans | 100.0 /100 | #28 | Exceptional 85.9% |
| Immigrants | Liberia | 100.0 /100 | #29 | Exceptional 85.9% |
| Immigrants | Serbia | 100.0 /100 | #30 | Exceptional 85.9% |
| German Russians | 100.0 /100 | #31 | Exceptional 85.8% |
| Slovaks | 100.0 /100 | #32 | Exceptional 85.8% |
| Immigrants | Bulgaria | 100.0 /100 | #33 | Exceptional 85.8% |
| Lithuanians | 99.9 /100 | #34 | Exceptional 85.8% |
| Cypriots | 99.9 /100 | #35 | Exceptional 85.8% |
| Immigrants | Nepal | 99.9 /100 | #36 | Exceptional 85.8% |
Demographics Similar to Israelis by In Labor Force | Age 25-29
In terms of in labor force | age 25-29, the demographic groups most similar to Israelis are Immigrants from Ecuador (84.3%, a difference of 0.0%), Immigrants from Nigeria (84.3%, a difference of 0.010%), Immigrants from Saudi Arabia (84.3%, a difference of 0.010%), Immigrants from Syria (84.3%, a difference of 0.030%), and Japanese (84.3%, a difference of 0.040%).
| Demographics | Rating | Rank | In Labor Force | Age 25-29 |
| Immigrants | Jordan | 12.8 /100 | #209 | Poor 84.4% |
| Chinese | 12.7 /100 | #210 | Poor 84.3% |
| Immigrants | Venezuela | 12.6 /100 | #211 | Poor 84.3% |
| Sub-Saharan Africans | 11.7 /100 | #212 | Poor 84.3% |
| Japanese | 11.4 /100 | #213 | Poor 84.3% |
| Lebanese | 11.1 /100 | #214 | Poor 84.3% |
| Immigrants | Syria | 10.7 /100 | #215 | Poor 84.3% |
| Israelis | 9.3 /100 | #216 | Tragic 84.3% |
| Immigrants | Ecuador | 9.3 /100 | #217 | Tragic 84.3% |
| Immigrants | Nigeria | 9.0 /100 | #218 | Tragic 84.3% |
| Immigrants | Saudi Arabia | 8.8 /100 | #219 | Tragic 84.3% |
| Nigerians | 7.2 /100 | #220 | Tragic 84.3% |
| Arabs | 6.8 /100 | #221 | Tragic 84.2% |
| Jordanians | 6.7 /100 | #222 | Tragic 84.2% |
| Scotch-Irish | 6.5 /100 | #223 | Tragic 84.2% |