Immigrants from Liberia vs Immigrants from Romania Householder Income Ages 25 - 44 years
COMPARE
Immigrants from Liberia
Immigrants from Romania
Householder Income Ages 25 - 44 years
Householder Income Ages 25 - 44 years Comparison
Immigrants from Liberia
Immigrants from Romania
$80,863
HOUSEHOLDER INCOME AGES 25 - 44 YEARS
0.1/ 100
METRIC RATING
299th/ 347
METRIC RANK
$104,713
HOUSEHOLDER INCOME AGES 25 - 44 YEARS
99.6/ 100
METRIC RATING
67th/ 347
METRIC RANK
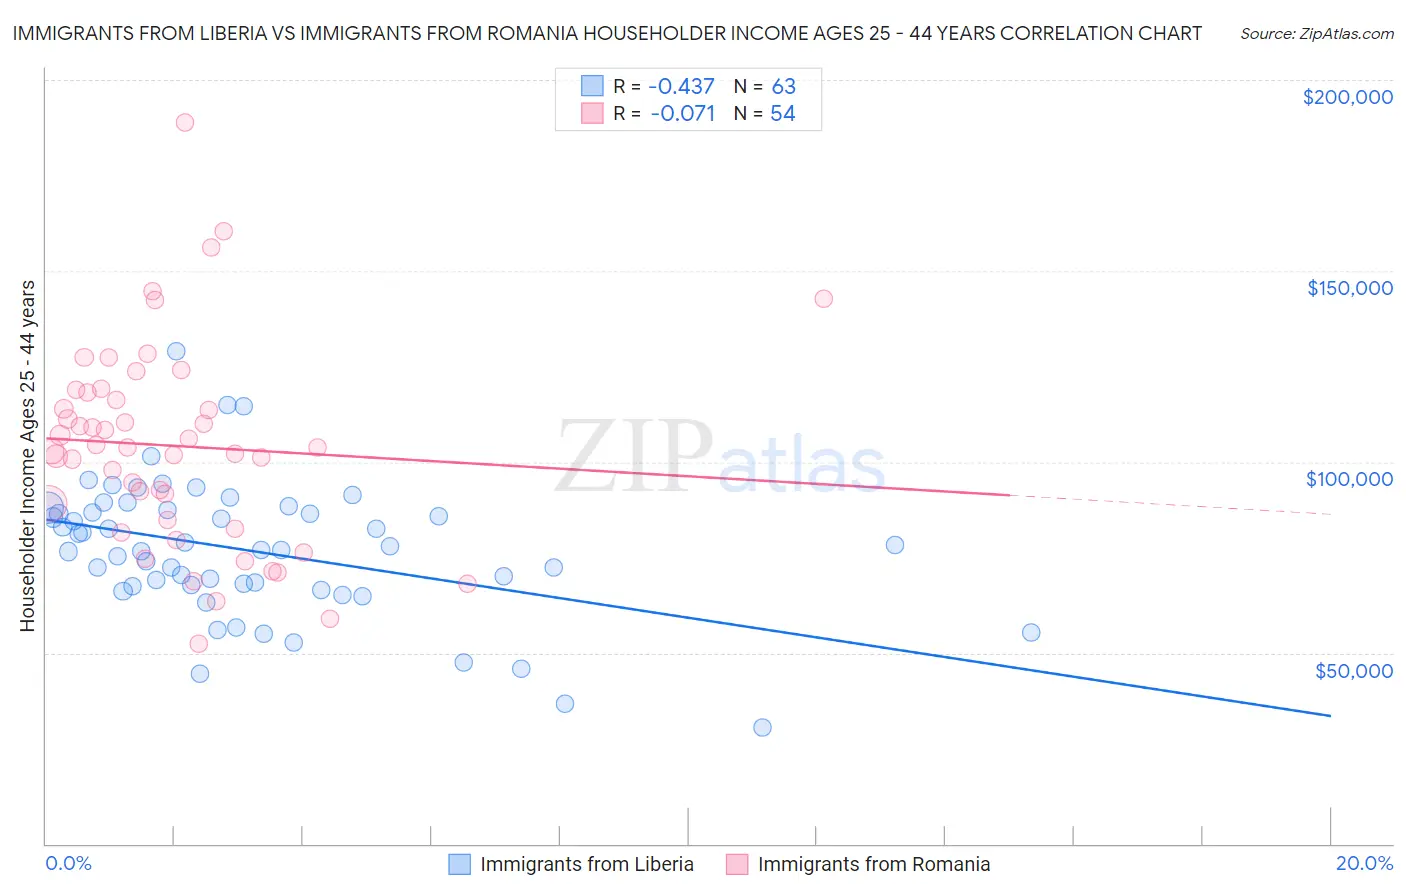
Immigrants from Liberia vs Immigrants from Romania Householder Income Ages 25 - 44 years Correlation Chart
The statistical analysis conducted on geographies consisting of 135,196,849 people shows a moderate negative correlation between the proportion of Immigrants from Liberia and household income with householder between the ages 25 and 44 in the United States with a correlation coefficient (R) of -0.437 and weighted average of $80,863. Similarly, the statistical analysis conducted on geographies consisting of 256,633,745 people shows a slight negative correlation between the proportion of Immigrants from Romania and household income with householder between the ages 25 and 44 in the United States with a correlation coefficient (R) of -0.071 and weighted average of $104,713, a difference of 29.5%.
Householder Income Ages 25 - 44 years Correlation Summary
| Measurement | Immigrants from Liberia | Immigrants from Romania |
| Minimum | $30,517 | $52,260 |
| Maximum | $129,042 | $188,943 |
| Range | $98,525 | $136,683 |
| Mean | $76,665 | $104,157 |
| Median | $77,079 | $103,726 |
| Interquartile 25% (IQ1) | $67,377 | $84,716 |
| Interquartile 75% (IQ3) | $87,370 | $118,244 |
| Interquartile Range (IQR) | $19,994 | $33,528 |
| Standard Deviation (Sample) | $17,857 | $26,678 |
| Standard Deviation (Population) | $17,715 | $26,430 |
Similar Demographics by Householder Income Ages 25 - 44 years
Demographics Similar to Immigrants from Liberia by Householder Income Ages 25 - 44 years
In terms of householder income ages 25 - 44 years, the demographic groups most similar to Immigrants from Liberia are Cherokee ($80,843, a difference of 0.020%), Immigrants from Micronesia ($80,544, a difference of 0.40%), Hispanic or Latino ($80,515, a difference of 0.43%), Dominican ($81,229, a difference of 0.45%), and Mexican ($80,427, a difference of 0.54%).
| Demographics | Rating | Rank | Householder Income Ages 25 - 44 years |
| Yaqui | 0.1 /100 | #292 | Tragic $81,656 |
| Blackfeet | 0.1 /100 | #293 | Tragic $81,531 |
| Cubans | 0.1 /100 | #294 | Tragic $81,483 |
| Bangladeshis | 0.1 /100 | #295 | Tragic $81,363 |
| Immigrants | Dominica | 0.1 /100 | #296 | Tragic $81,351 |
| Immigrants | Guatemala | 0.1 /100 | #297 | Tragic $81,341 |
| Dominicans | 0.1 /100 | #298 | Tragic $81,229 |
| Immigrants | Liberia | 0.1 /100 | #299 | Tragic $80,863 |
| Cherokee | 0.0 /100 | #300 | Tragic $80,843 |
| Immigrants | Micronesia | 0.0 /100 | #301 | Tragic $80,544 |
| Hispanics or Latinos | 0.0 /100 | #302 | Tragic $80,515 |
| Mexicans | 0.0 /100 | #303 | Tragic $80,427 |
| Immigrants | Caribbean | 0.0 /100 | #304 | Tragic $80,326 |
| Immigrants | Dominican Republic | 0.0 /100 | #305 | Tragic $80,319 |
| Apache | 0.0 /100 | #306 | Tragic $80,260 |
Demographics Similar to Immigrants from Romania by Householder Income Ages 25 - 44 years
In terms of householder income ages 25 - 44 years, the demographic groups most similar to Immigrants from Romania are Immigrants from Eastern Europe ($104,662, a difference of 0.050%), Mongolian ($104,578, a difference of 0.13%), Immigrants from Croatia ($104,503, a difference of 0.20%), Laotian ($104,993, a difference of 0.27%), and Afghan ($104,410, a difference of 0.29%).
| Demographics | Rating | Rank | Householder Income Ages 25 - 44 years |
| Egyptians | 99.7 /100 | #60 | Exceptional $105,282 |
| Lithuanians | 99.7 /100 | #61 | Exceptional $105,223 |
| Immigrants | Italy | 99.7 /100 | #62 | Exceptional $105,201 |
| Immigrants | Scotland | 99.7 /100 | #63 | Exceptional $105,089 |
| New Zealanders | 99.7 /100 | #64 | Exceptional $105,085 |
| Immigrants | Netherlands | 99.7 /100 | #65 | Exceptional $105,082 |
| Laotians | 99.7 /100 | #66 | Exceptional $104,993 |
| Immigrants | Romania | 99.6 /100 | #67 | Exceptional $104,713 |
| Immigrants | Eastern Europe | 99.6 /100 | #68 | Exceptional $104,662 |
| Mongolians | 99.6 /100 | #69 | Exceptional $104,578 |
| Immigrants | Croatia | 99.6 /100 | #70 | Exceptional $104,503 |
| Afghans | 99.6 /100 | #71 | Exceptional $104,410 |
| Chinese | 99.5 /100 | #72 | Exceptional $104,264 |
| Italians | 99.5 /100 | #73 | Exceptional $104,215 |
| Immigrants | Fiji | 99.5 /100 | #74 | Exceptional $103,954 |