Immigrants from Norway vs Hopi Median Family Income
COMPARE
Immigrants from Norway
Hopi
Median Family Income
Median Family Income Comparison
Immigrants from Norway
Hopi
$115,847
MEDIAN FAMILY INCOME
99.9/ 100
METRIC RATING
53rd/ 347
METRIC RANK
$77,188
MEDIAN FAMILY INCOME
0.0/ 100
METRIC RATING
340th/ 347
METRIC RANK
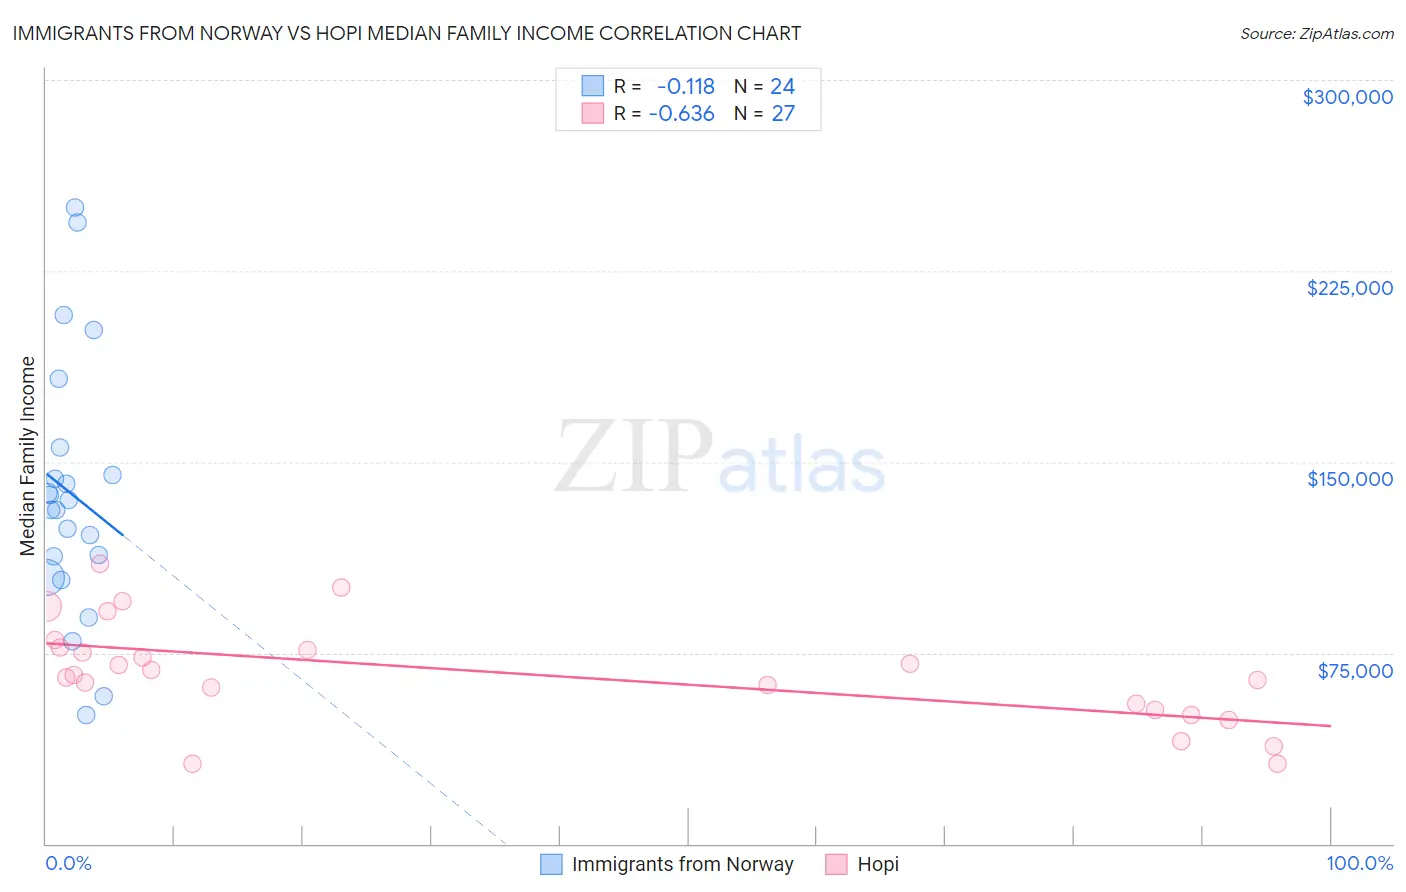
Immigrants from Norway vs Hopi Median Family Income Correlation Chart
The statistical analysis conducted on geographies consisting of 116,680,488 people shows a poor negative correlation between the proportion of Immigrants from Norway and median family income in the United States with a correlation coefficient (R) of -0.118 and weighted average of $115,847. Similarly, the statistical analysis conducted on geographies consisting of 74,729,125 people shows a significant negative correlation between the proportion of Hopi and median family income in the United States with a correlation coefficient (R) of -0.636 and weighted average of $77,188, a difference of 50.1%.
Median Family Income Correlation Summary
| Measurement | Immigrants from Norway | Hopi |
| Minimum | $50,417 | $31,250 |
| Maximum | $250,001 | $109,922 |
| Range | $199,584 | $78,672 |
| Mean | $137,530 | $67,112 |
| Median | $133,287 | $66,093 |
| Interquartile 25% (IQ1) | $108,664 | $52,500 |
| Interquartile 75% (IQ3) | $150,184 | $76,955 |
| Interquartile Range (IQR) | $41,519 | $24,455 |
| Standard Deviation (Sample) | $50,729 | $20,243 |
| Standard Deviation (Population) | $49,661 | $19,865 |
Similar Demographics by Median Family Income
Demographics Similar to Immigrants from Norway by Median Family Income
In terms of median family income, the demographic groups most similar to Immigrants from Norway are Maltese ($115,862, a difference of 0.010%), Immigrants from Malaysia ($115,880, a difference of 0.030%), Immigrants from Czechoslovakia ($116,165, a difference of 0.27%), Immigrants from Europe ($115,523, a difference of 0.28%), and Chinese ($116,188, a difference of 0.29%).
| Demographics | Rating | Rank | Median Family Income |
| Immigrants | Russia | 99.9 /100 | #46 | Exceptional $116,942 |
| Immigrants | Austria | 99.9 /100 | #47 | Exceptional $116,830 |
| Immigrants | South Africa | 99.9 /100 | #48 | Exceptional $116,286 |
| Chinese | 99.9 /100 | #49 | Exceptional $116,188 |
| Immigrants | Czechoslovakia | 99.9 /100 | #50 | Exceptional $116,165 |
| Immigrants | Malaysia | 99.9 /100 | #51 | Exceptional $115,880 |
| Maltese | 99.9 /100 | #52 | Exceptional $115,862 |
| Immigrants | Norway | 99.9 /100 | #53 | Exceptional $115,847 |
| Immigrants | Europe | 99.9 /100 | #54 | Exceptional $115,523 |
| Lithuanians | 99.8 /100 | #55 | Exceptional $115,395 |
| New Zealanders | 99.8 /100 | #56 | Exceptional $115,230 |
| Greeks | 99.8 /100 | #57 | Exceptional $115,192 |
| Immigrants | Indonesia | 99.8 /100 | #58 | Exceptional $115,162 |
| Immigrants | Netherlands | 99.8 /100 | #59 | Exceptional $114,987 |
| Immigrants | Latvia | 99.8 /100 | #60 | Exceptional $114,826 |
Demographics Similar to Hopi by Median Family Income
In terms of median family income, the demographic groups most similar to Hopi are Pima ($77,431, a difference of 0.32%), Immigrants from Yemen ($77,457, a difference of 0.35%), Pueblo ($76,880, a difference of 0.40%), Crow ($76,605, a difference of 0.76%), and Yuman ($78,055, a difference of 1.1%).
| Demographics | Rating | Rank | Median Family Income |
| Kiowa | 0.0 /100 | #333 | Tragic $80,885 |
| Menominee | 0.0 /100 | #334 | Tragic $79,563 |
| Yup'ik | 0.0 /100 | #335 | Tragic $79,290 |
| Immigrants | Cuba | 0.0 /100 | #336 | Tragic $78,249 |
| Yuman | 0.0 /100 | #337 | Tragic $78,055 |
| Immigrants | Yemen | 0.0 /100 | #338 | Tragic $77,457 |
| Pima | 0.0 /100 | #339 | Tragic $77,431 |
| Hopi | 0.0 /100 | #340 | Tragic $77,188 |
| Pueblo | 0.0 /100 | #341 | Tragic $76,880 |
| Crow | 0.0 /100 | #342 | Tragic $76,605 |
| Houma | 0.0 /100 | #343 | Tragic $76,188 |
| Tohono O'odham | 0.0 /100 | #344 | Tragic $72,193 |
| Navajo | 0.0 /100 | #345 | Tragic $70,989 |
| Puerto Ricans | 0.0 /100 | #346 | Tragic $70,423 |
| Lumbee | 0.0 /100 | #347 | Tragic $68,679 |