Immigrants from Liberia vs Hopi Associate's Degree
COMPARE
Immigrants from Liberia
Hopi
Associate's Degree
Associate's Degree Comparison
Immigrants from Liberia
Hopi
42.3%
ASSOCIATE'S DEGREE
0.9/ 100
METRIC RATING
244th/ 347
METRIC RANK
34.6%
ASSOCIATE'S DEGREE
0.0/ 100
METRIC RATING
336th/ 347
METRIC RANK
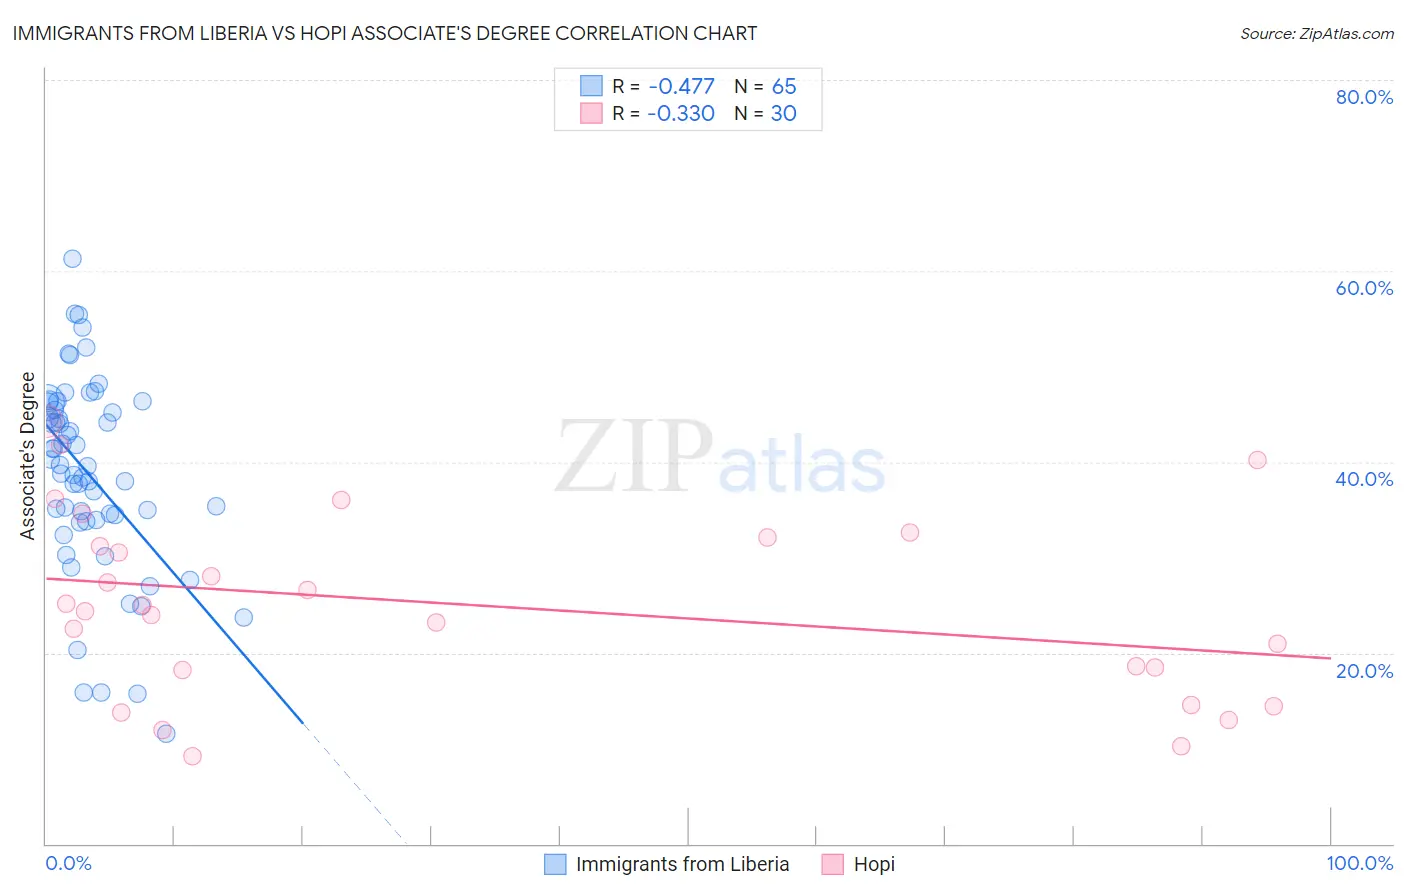
Immigrants from Liberia vs Hopi Associate's Degree Correlation Chart
The statistical analysis conducted on geographies consisting of 135,295,697 people shows a moderate negative correlation between the proportion of Immigrants from Liberia and percentage of population with at least associate's degree education in the United States with a correlation coefficient (R) of -0.477 and weighted average of 42.3%. Similarly, the statistical analysis conducted on geographies consisting of 74,740,168 people shows a mild negative correlation between the proportion of Hopi and percentage of population with at least associate's degree education in the United States with a correlation coefficient (R) of -0.330 and weighted average of 34.6%, a difference of 22.3%.
Associate's Degree Correlation Summary
| Measurement | Immigrants from Liberia | Hopi |
| Minimum | 11.5% | 9.2% |
| Maximum | 61.3% | 44.2% |
| Range | 49.8% | 35.0% |
| Mean | 38.6% | 25.0% |
| Median | 39.5% | 24.6% |
| Interquartile 25% (IQ1) | 33.9% | 18.2% |
| Interquartile 75% (IQ3) | 45.8% | 32.1% |
| Interquartile Range (IQR) | 12.0% | 13.9% |
| Standard Deviation (Sample) | 10.2% | 9.7% |
| Standard Deviation (Population) | 10.2% | 9.5% |
Similar Demographics by Associate's Degree
Demographics Similar to Immigrants from Liberia by Associate's Degree
In terms of associate's degree, the demographic groups most similar to Immigrants from Liberia are Immigrants from Cambodia (42.3%, a difference of 0.020%), Delaware (42.3%, a difference of 0.050%), Guyanese (42.3%, a difference of 0.14%), Immigrants from Fiji (42.2%, a difference of 0.14%), and Immigrants from Ecuador (42.2%, a difference of 0.23%).
| Demographics | Rating | Rank | Associate's Degree |
| Immigrants | Nonimmigrants | 1.9 /100 | #237 | Tragic 42.9% |
| Iroquois | 1.7 /100 | #238 | Tragic 42.8% |
| Immigrants | Grenada | 1.3 /100 | #239 | Tragic 42.6% |
| Cree | 1.2 /100 | #240 | Tragic 42.5% |
| British West Indians | 1.0 /100 | #241 | Tragic 42.4% |
| Immigrants | West Indies | 1.0 /100 | #242 | Tragic 42.4% |
| Guyanese | 1.0 /100 | #243 | Tragic 42.3% |
| Immigrants | Liberia | 0.9 /100 | #244 | Tragic 42.3% |
| Immigrants | Cambodia | 0.9 /100 | #245 | Tragic 42.3% |
| Delaware | 0.9 /100 | #246 | Tragic 42.3% |
| Immigrants | Fiji | 0.8 /100 | #247 | Tragic 42.2% |
| Immigrants | Ecuador | 0.8 /100 | #248 | Tragic 42.2% |
| Jamaicans | 0.7 /100 | #249 | Tragic 42.1% |
| U.S. Virgin Islanders | 0.7 /100 | #250 | Tragic 42.1% |
| Immigrants | Bahamas | 0.7 /100 | #251 | Tragic 42.1% |
Demographics Similar to Hopi by Associate's Degree
In terms of associate's degree, the demographic groups most similar to Hopi are Spanish American Indian (34.9%, a difference of 0.88%), Native/Alaskan (34.9%, a difference of 1.0%), Mexican (35.0%, a difference of 1.3%), Lumbee (34.1%, a difference of 1.3%), and Immigrants from Central America (35.0%, a difference of 1.3%).
| Demographics | Rating | Rank | Associate's Degree |
| Paiute | 0.0 /100 | #329 | Tragic 36.4% |
| Apache | 0.0 /100 | #330 | Tragic 36.2% |
| Immigrants | Azores | 0.0 /100 | #331 | Tragic 35.6% |
| Immigrants | Central America | 0.0 /100 | #332 | Tragic 35.0% |
| Mexicans | 0.0 /100 | #333 | Tragic 35.0% |
| Natives/Alaskans | 0.0 /100 | #334 | Tragic 34.9% |
| Spanish American Indians | 0.0 /100 | #335 | Tragic 34.9% |
| Hopi | 0.0 /100 | #336 | Tragic 34.6% |
| Lumbee | 0.0 /100 | #337 | Tragic 34.1% |
| Pueblo | 0.0 /100 | #338 | Tragic 34.0% |
| Immigrants | Mexico | 0.0 /100 | #339 | Tragic 33.7% |
| Navajo | 0.0 /100 | #340 | Tragic 32.6% |
| Inupiat | 0.0 /100 | #341 | Tragic 32.6% |
| Yakama | 0.0 /100 | #342 | Tragic 32.3% |
| Tohono O'odham | 0.0 /100 | #343 | Tragic 31.8% |