Immigrants from Cambodia vs Nonimmigrants Median Family Income
COMPARE
Immigrants from Cambodia
Nonimmigrants
Median Family Income
Median Family Income Comparison
Immigrants from Cambodia
Nonimmigrants
$97,222
MEDIAN FAMILY INCOME
5.8/ 100
METRIC RATING
218th/ 347
METRIC RANK
$96,231
MEDIAN FAMILY INCOME
3.6/ 100
METRIC RATING
224th/ 347
METRIC RANK
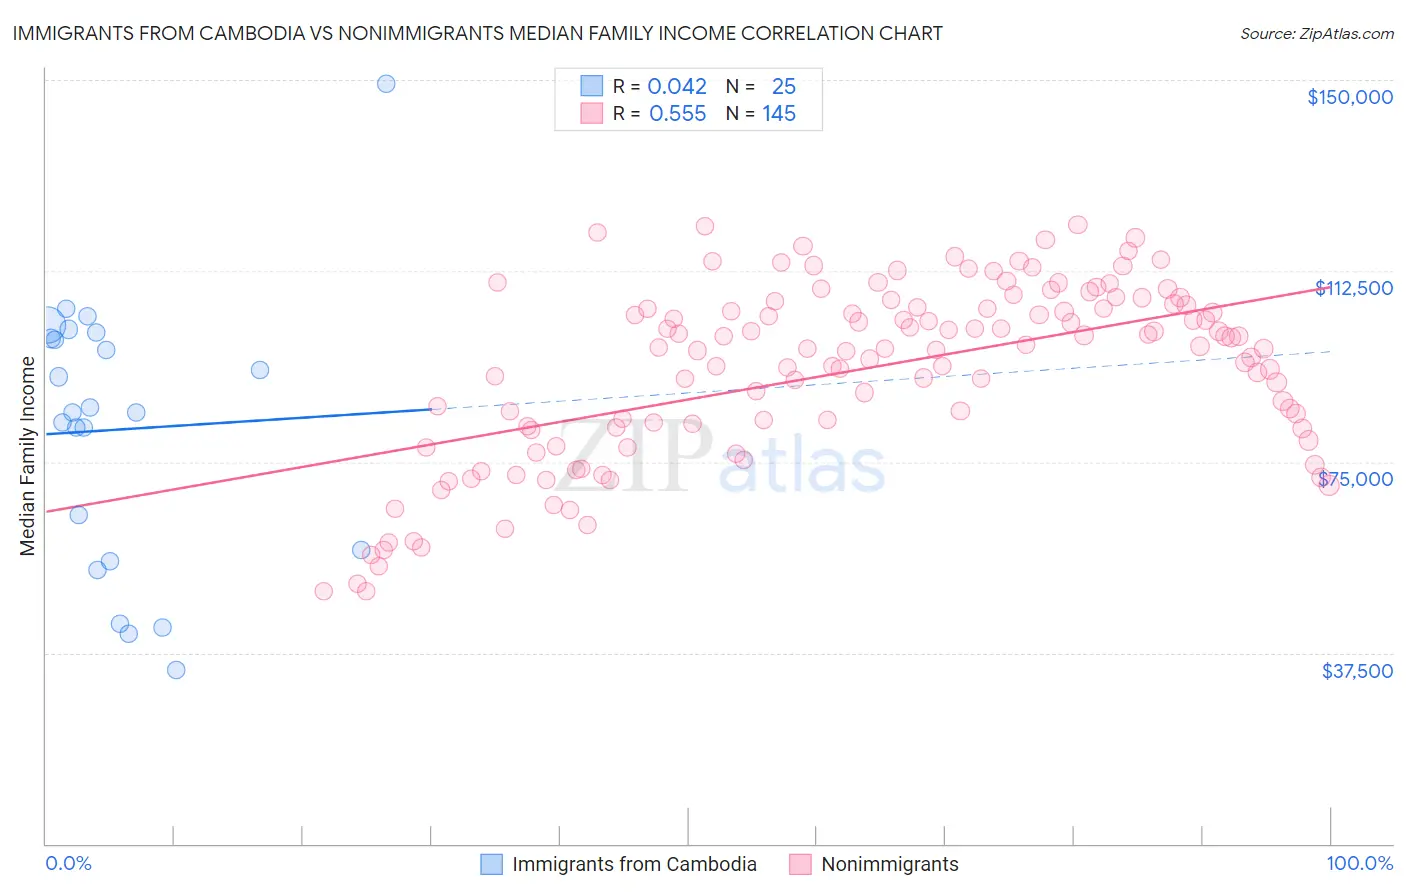
Immigrants from Cambodia vs Nonimmigrants Median Family Income Correlation Chart
The statistical analysis conducted on geographies consisting of 205,119,911 people shows no correlation between the proportion of Immigrants from Cambodia and median family income in the United States with a correlation coefficient (R) of 0.042 and weighted average of $97,222. Similarly, the statistical analysis conducted on geographies consisting of 582,429,666 people shows a substantial positive correlation between the proportion of Nonimmigrants and median family income in the United States with a correlation coefficient (R) of 0.555 and weighted average of $96,231, a difference of 1.0%.
Median Family Income Correlation Summary
| Measurement | Immigrants from Cambodia | Nonimmigrants |
| Minimum | $34,076 | $49,547 |
| Maximum | $149,239 | $121,513 |
| Range | $115,163 | $71,966 |
| Mean | $81,395 | $93,127 |
| Median | $84,615 | $97,277 |
| Interquartile 25% (IQ1) | $56,570 | $81,657 |
| Interquartile 75% (IQ3) | $99,835 | $105,547 |
| Interquartile Range (IQR) | $43,265 | $23,890 |
| Standard Deviation (Sample) | $26,680 | $17,276 |
| Standard Deviation (Population) | $26,141 | $17,216 |
Demographics Similar to Immigrants from Cambodia and Nonimmigrants by Median Family Income
In terms of median family income, the demographic groups most similar to Immigrants from Cambodia are Japanese ($97,288, a difference of 0.070%), Immigrants from Bosnia and Herzegovina ($97,432, a difference of 0.22%), Delaware ($96,958, a difference of 0.27%), Nigerian ($97,522, a difference of 0.31%), and Bermudan ($97,577, a difference of 0.36%). Similarly, the demographic groups most similar to Nonimmigrants are Venezuelan ($96,281, a difference of 0.050%), Vietnamese ($96,123, a difference of 0.11%), Immigrants from Nigeria ($96,439, a difference of 0.22%), Immigrants from Ghana ($96,544, a difference of 0.33%), and Sudanese ($96,783, a difference of 0.57%).
| Demographics | Rating | Rank | Median Family Income |
| Immigrants | Sudan | 7.4 /100 | #211 | Tragic $97,737 |
| Panamanians | 7.2 /100 | #212 | Tragic $97,683 |
| Immigrants | Armenia | 7.0 /100 | #213 | Tragic $97,605 |
| Bermudans | 6.9 /100 | #214 | Tragic $97,577 |
| Nigerians | 6.7 /100 | #215 | Tragic $97,522 |
| Immigrants | Bosnia and Herzegovina | 6.4 /100 | #216 | Tragic $97,432 |
| Japanese | 6.0 /100 | #217 | Tragic $97,288 |
| Immigrants | Cambodia | 5.8 /100 | #218 | Tragic $97,222 |
| Delaware | 5.1 /100 | #219 | Tragic $96,958 |
| Sudanese | 4.7 /100 | #220 | Tragic $96,783 |
| Immigrants | Ghana | 4.2 /100 | #221 | Tragic $96,544 |
| Immigrants | Nigeria | 4.0 /100 | #222 | Tragic $96,439 |
| Venezuelans | 3.7 /100 | #223 | Tragic $96,281 |
| Immigrants | Nonimmigrants | 3.6 /100 | #224 | Tragic $96,231 |
| Vietnamese | 3.4 /100 | #225 | Tragic $96,123 |
| Immigrants | Panama | 2.7 /100 | #226 | Tragic $95,647 |
| Alaska Natives | 2.6 /100 | #227 | Tragic $95,573 |
| Immigrants | Azores | 2.4 /100 | #228 | Tragic $95,402 |
| Marshallese | 2.2 /100 | #229 | Tragic $95,293 |
| Malaysians | 2.2 /100 | #230 | Tragic $95,230 |
| Ecuadorians | 2.1 /100 | #231 | Tragic $95,114 |