Immigrants from Latin America vs Arapaho Median Female Earnings
COMPARE
Immigrants from Latin America
Arapaho
Median Female Earnings
Median Female Earnings Comparison
Immigrants from Latin America
Arapaho
$35,307
MEDIAN FEMALE EARNINGS
0.0/ 100
METRIC RATING
303rd/ 347
METRIC RANK
$31,489
MEDIAN FEMALE EARNINGS
0.0/ 100
METRIC RATING
346th/ 347
METRIC RANK
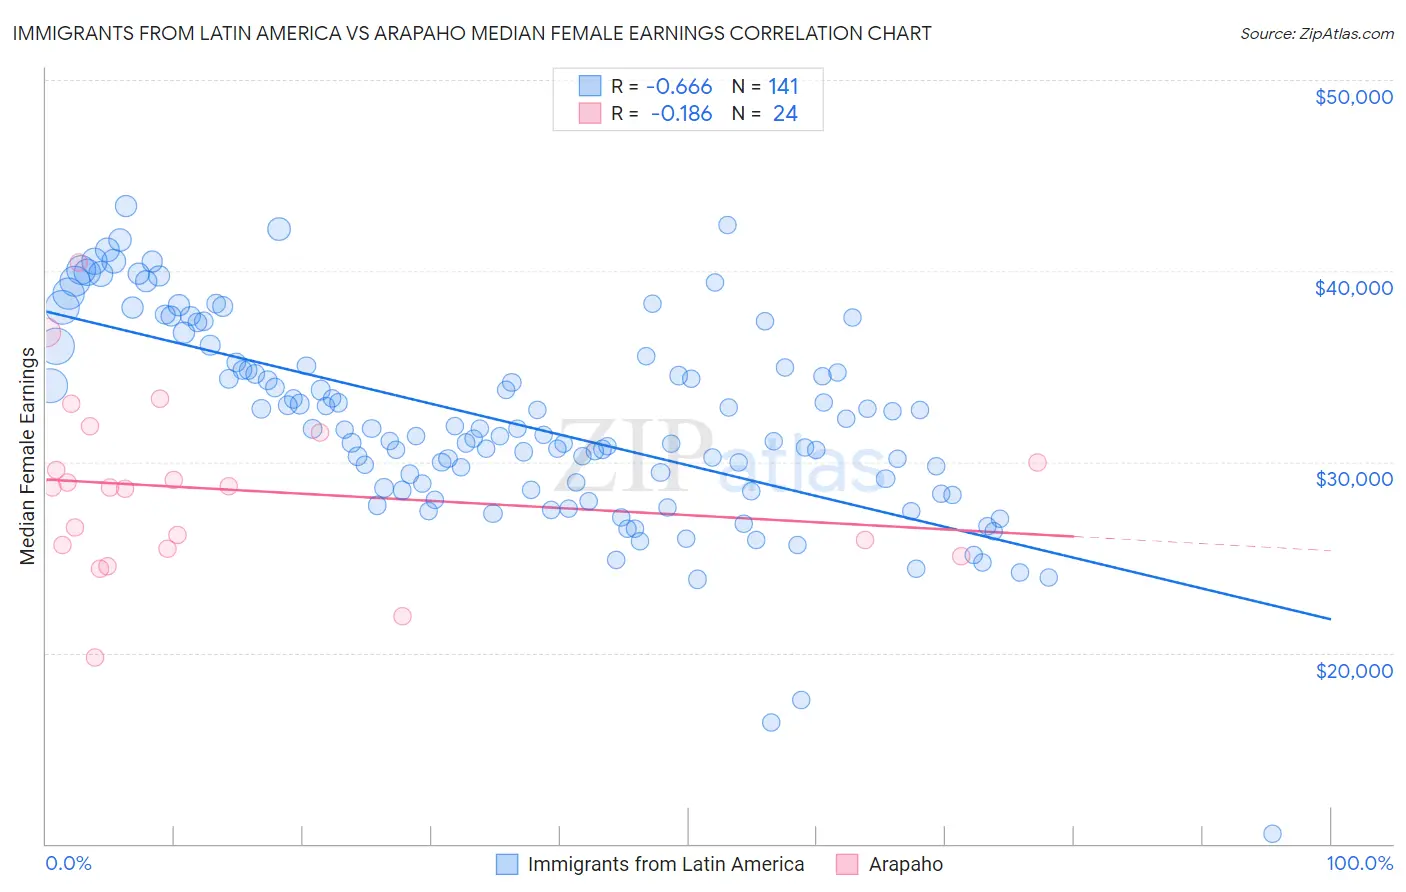
Immigrants from Latin America vs Arapaho Median Female Earnings Correlation Chart
The statistical analysis conducted on geographies consisting of 557,242,268 people shows a significant negative correlation between the proportion of Immigrants from Latin America and median female earnings in the United States with a correlation coefficient (R) of -0.666 and weighted average of $35,307. Similarly, the statistical analysis conducted on geographies consisting of 29,776,290 people shows a poor negative correlation between the proportion of Arapaho and median female earnings in the United States with a correlation coefficient (R) of -0.186 and weighted average of $31,489, a difference of 12.1%.
Median Female Earnings Correlation Summary
| Measurement | Immigrants from Latin America | Arapaho |
| Minimum | $10,532 | $19,750 |
| Maximum | $43,408 | $40,452 |
| Range | $32,876 | $20,702 |
| Mean | $32,057 | $28,528 |
| Median | $31,685 | $28,660 |
| Interquartile 25% (IQ1) | $28,590 | $25,558 |
| Interquartile 75% (IQ3) | $35,130 | $30,782 |
| Interquartile Range (IQR) | $6,540 | $5,224 |
| Standard Deviation (Sample) | $5,280 | $4,555 |
| Standard Deviation (Population) | $5,261 | $4,459 |
Similar Demographics by Median Female Earnings
Demographics Similar to Immigrants from Latin America by Median Female Earnings
In terms of median female earnings, the demographic groups most similar to Immigrants from Latin America are Black/African American ($35,315, a difference of 0.020%), Pima ($35,326, a difference of 0.050%), Crow ($35,266, a difference of 0.11%), Yuman ($35,377, a difference of 0.20%), and Immigrants from Guatemala ($35,444, a difference of 0.39%).
| Demographics | Rating | Rank | Median Female Earnings |
| Mexican American Indians | 0.0 /100 | #296 | Tragic $35,629 |
| Hmong | 0.0 /100 | #297 | Tragic $35,498 |
| Immigrants | Micronesia | 0.0 /100 | #298 | Tragic $35,477 |
| Immigrants | Guatemala | 0.0 /100 | #299 | Tragic $35,444 |
| Yuman | 0.0 /100 | #300 | Tragic $35,377 |
| Pima | 0.0 /100 | #301 | Tragic $35,326 |
| Blacks/African Americans | 0.0 /100 | #302 | Tragic $35,315 |
| Immigrants | Latin America | 0.0 /100 | #303 | Tragic $35,307 |
| Crow | 0.0 /100 | #304 | Tragic $35,266 |
| Bahamians | 0.0 /100 | #305 | Tragic $35,125 |
| Fijians | 0.0 /100 | #306 | Tragic $35,114 |
| Sioux | 0.0 /100 | #307 | Tragic $35,063 |
| Immigrants | Bahamas | 0.0 /100 | #308 | Tragic $35,027 |
| Hondurans | 0.0 /100 | #309 | Tragic $35,013 |
| Chippewa | 0.0 /100 | #310 | Tragic $35,003 |
Demographics Similar to Arapaho by Median Female Earnings
In terms of median female earnings, the demographic groups most similar to Arapaho are Puerto Rican ($31,560, a difference of 0.23%), Lumbee ($32,500, a difference of 3.2%), Pueblo ($32,564, a difference of 3.4%), Houma ($30,343, a difference of 3.8%), and Yup'ik ($32,730, a difference of 3.9%).
| Demographics | Rating | Rank | Median Female Earnings |
| Mexicans | 0.0 /100 | #333 | Tragic $33,664 |
| Spanish American Indians | 0.0 /100 | #334 | Tragic $33,625 |
| Creek | 0.0 /100 | #335 | Tragic $33,437 |
| Ottawa | 0.0 /100 | #336 | Tragic $33,378 |
| Yakama | 0.0 /100 | #337 | Tragic $33,354 |
| Immigrants | Cuba | 0.0 /100 | #338 | Tragic $33,291 |
| Immigrants | Mexico | 0.0 /100 | #339 | Tragic $33,236 |
| Tohono O'odham | 0.0 /100 | #340 | Tragic $33,205 |
| Navajo | 0.0 /100 | #341 | Tragic $33,046 |
| Yup'ik | 0.0 /100 | #342 | Tragic $32,730 |
| Pueblo | 0.0 /100 | #343 | Tragic $32,564 |
| Lumbee | 0.0 /100 | #344 | Tragic $32,500 |
| Puerto Ricans | 0.0 /100 | #345 | Tragic $31,560 |
| Arapaho | 0.0 /100 | #346 | Tragic $31,489 |
| Houma | 0.0 /100 | #347 | Tragic $30,343 |