Immigrants from Laos vs Ugandan Per Capita Income
COMPARE
Immigrants from Laos
Ugandan
Per Capita Income
Per Capita Income Comparison
Immigrants from Laos
Ugandans
$37,857
PER CAPITA INCOME
0.1/ 100
METRIC RATING
282nd/ 347
METRIC RANK
$45,047
PER CAPITA INCOME
82.6/ 100
METRIC RATING
142nd/ 347
METRIC RANK
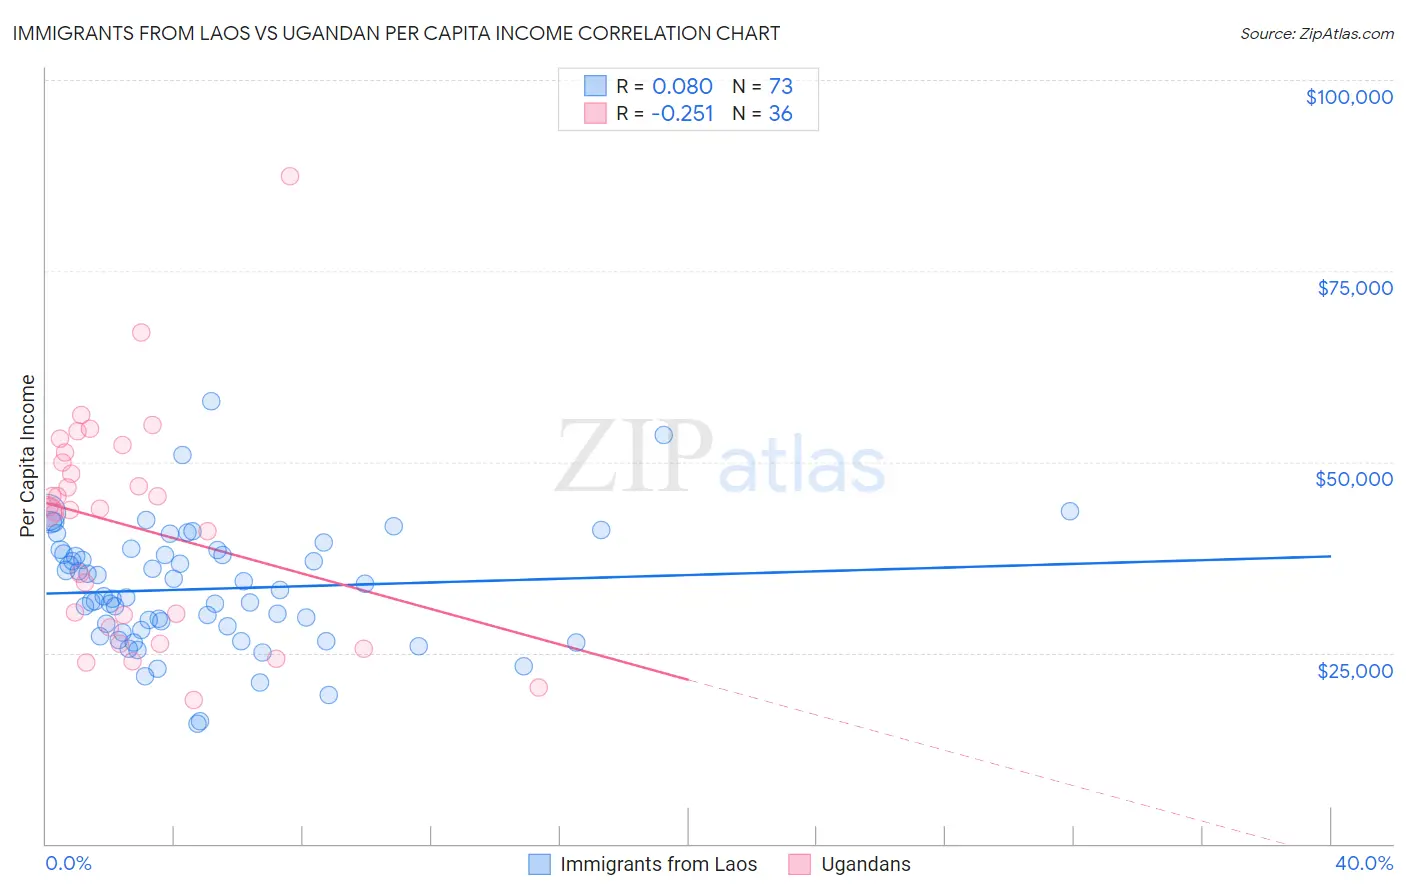
Immigrants from Laos vs Ugandan Per Capita Income Correlation Chart
The statistical analysis conducted on geographies consisting of 201,476,108 people shows a slight positive correlation between the proportion of Immigrants from Laos and per capita income in the United States with a correlation coefficient (R) of 0.080 and weighted average of $37,857. Similarly, the statistical analysis conducted on geographies consisting of 94,012,894 people shows a weak negative correlation between the proportion of Ugandans and per capita income in the United States with a correlation coefficient (R) of -0.251 and weighted average of $45,047, a difference of 19.0%.
Per Capita Income Correlation Summary
| Measurement | Immigrants from Laos | Ugandan |
| Minimum | $15,753 | $18,741 |
| Maximum | $57,923 | $87,401 |
| Range | $42,170 | $68,660 |
| Mean | $33,364 | $41,524 |
| Median | $32,473 | $43,788 |
| Interquartile 25% (IQ1) | $27,819 | $29,158 |
| Interquartile 75% (IQ3) | $38,151 | $50,579 |
| Interquartile Range (IQR) | $10,332 | $21,420 |
| Standard Deviation (Sample) | $7,853 | $14,466 |
| Standard Deviation (Population) | $7,799 | $14,264 |
Similar Demographics by Per Capita Income
Demographics Similar to Immigrants from Laos by Per Capita Income
In terms of per capita income, the demographic groups most similar to Immigrants from Laos are Pennsylvania German ($37,842, a difference of 0.040%), African ($37,785, a difference of 0.19%), Guatemalan ($37,766, a difference of 0.24%), Immigrants from Dominica ($37,952, a difference of 0.25%), and Central American Indian ($37,699, a difference of 0.42%).
| Demographics | Rating | Rank | Per Capita Income |
| Immigrants | Liberia | 0.2 /100 | #275 | Tragic $38,165 |
| Hmong | 0.2 /100 | #276 | Tragic $38,120 |
| Comanche | 0.2 /100 | #277 | Tragic $38,088 |
| Immigrants | Nicaragua | 0.2 /100 | #278 | Tragic $38,065 |
| Colville | 0.2 /100 | #279 | Tragic $38,047 |
| Potawatomi | 0.2 /100 | #280 | Tragic $38,046 |
| Immigrants | Dominica | 0.2 /100 | #281 | Tragic $37,952 |
| Immigrants | Laos | 0.1 /100 | #282 | Tragic $37,857 |
| Pennsylvania Germans | 0.1 /100 | #283 | Tragic $37,842 |
| Africans | 0.1 /100 | #284 | Tragic $37,785 |
| Guatemalans | 0.1 /100 | #285 | Tragic $37,766 |
| Central American Indians | 0.1 /100 | #286 | Tragic $37,699 |
| Dominicans | 0.1 /100 | #287 | Tragic $37,697 |
| Blackfeet | 0.1 /100 | #288 | Tragic $37,695 |
| U.S. Virgin Islanders | 0.1 /100 | #289 | Tragic $37,589 |
Demographics Similar to Ugandans by Per Capita Income
In terms of per capita income, the demographic groups most similar to Ugandans are Slavic ($45,049, a difference of 0.0%), Immigrants from Uganda ($45,043, a difference of 0.010%), Immigrants from Jordan ($45,066, a difference of 0.040%), Basque ($45,086, a difference of 0.090%), and Icelander ($44,987, a difference of 0.13%).
| Demographics | Rating | Rank | Per Capita Income |
| Hungarians | 87.9 /100 | #135 | Excellent $45,426 |
| Immigrants | Oceania | 85.2 /100 | #136 | Excellent $45,220 |
| Immigrants | Syria | 85.2 /100 | #137 | Excellent $45,218 |
| Assyrians/Chaldeans/Syriacs | 84.8 /100 | #138 | Excellent $45,195 |
| Basques | 83.2 /100 | #139 | Excellent $45,086 |
| Immigrants | Jordan | 82.9 /100 | #140 | Excellent $45,066 |
| Slavs | 82.6 /100 | #141 | Excellent $45,049 |
| Ugandans | 82.6 /100 | #142 | Excellent $45,047 |
| Immigrants | Uganda | 82.5 /100 | #143 | Excellent $45,043 |
| Icelanders | 81.6 /100 | #144 | Excellent $44,987 |
| Immigrants | Afghanistan | 78.0 /100 | #145 | Good $44,790 |
| Irish | 75.8 /100 | #146 | Good $44,679 |
| Czechs | 74.1 /100 | #147 | Good $44,595 |
| Immigrants | Armenia | 73.1 /100 | #148 | Good $44,552 |
| Koreans | 72.5 /100 | #149 | Good $44,522 |