Immigrants from Laos vs Immigrants from Honduras Per Capita Income
COMPARE
Immigrants from Laos
Immigrants from Honduras
Per Capita Income
Per Capita Income Comparison
Immigrants from Laos
Immigrants from Honduras
$37,857
PER CAPITA INCOME
0.1/ 100
METRIC RATING
282nd/ 347
METRIC RANK
$36,665
PER CAPITA INCOME
0.0/ 100
METRIC RATING
309th/ 347
METRIC RANK
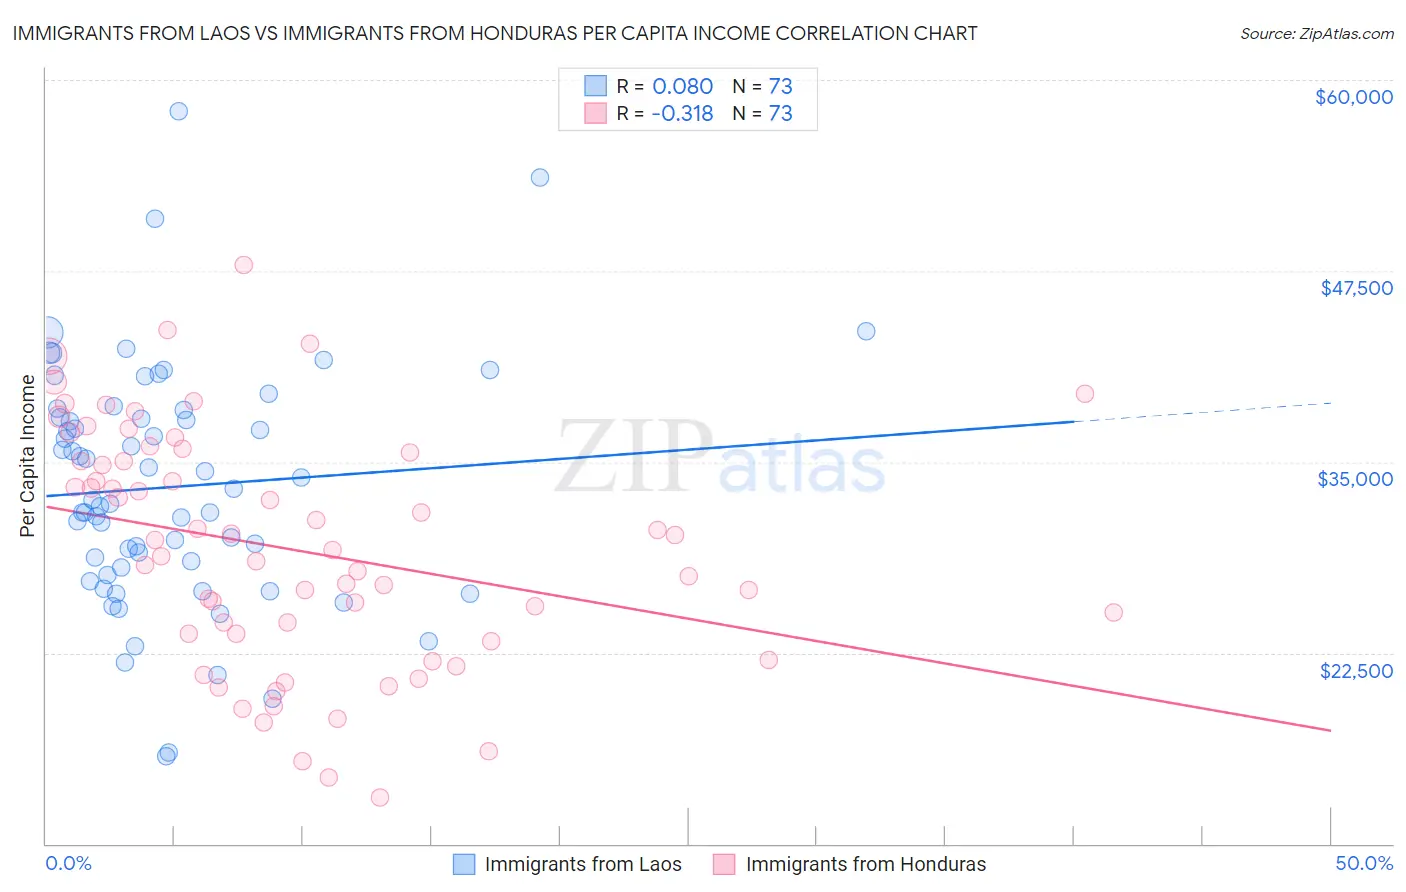
Immigrants from Laos vs Immigrants from Honduras Per Capita Income Correlation Chart
The statistical analysis conducted on geographies consisting of 201,476,108 people shows a slight positive correlation between the proportion of Immigrants from Laos and per capita income in the United States with a correlation coefficient (R) of 0.080 and weighted average of $37,857. Similarly, the statistical analysis conducted on geographies consisting of 322,641,994 people shows a mild negative correlation between the proportion of Immigrants from Honduras and per capita income in the United States with a correlation coefficient (R) of -0.318 and weighted average of $36,665, a difference of 3.3%.
Per Capita Income Correlation Summary
| Measurement | Immigrants from Laos | Immigrants from Honduras |
| Minimum | $15,753 | $13,018 |
| Maximum | $57,923 | $47,908 |
| Range | $42,170 | $34,890 |
| Mean | $33,364 | $29,255 |
| Median | $32,473 | $29,272 |
| Interquartile 25% (IQ1) | $27,819 | $23,483 |
| Interquartile 75% (IQ3) | $38,151 | $35,344 |
| Interquartile Range (IQR) | $10,332 | $11,861 |
| Standard Deviation (Sample) | $7,853 | $7,769 |
| Standard Deviation (Population) | $7,799 | $7,715 |
Similar Demographics by Per Capita Income
Demographics Similar to Immigrants from Laos by Per Capita Income
In terms of per capita income, the demographic groups most similar to Immigrants from Laos are Pennsylvania German ($37,842, a difference of 0.040%), African ($37,785, a difference of 0.19%), Guatemalan ($37,766, a difference of 0.24%), Immigrants from Dominica ($37,952, a difference of 0.25%), and Central American Indian ($37,699, a difference of 0.42%).
| Demographics | Rating | Rank | Per Capita Income |
| Immigrants | Liberia | 0.2 /100 | #275 | Tragic $38,165 |
| Hmong | 0.2 /100 | #276 | Tragic $38,120 |
| Comanche | 0.2 /100 | #277 | Tragic $38,088 |
| Immigrants | Nicaragua | 0.2 /100 | #278 | Tragic $38,065 |
| Colville | 0.2 /100 | #279 | Tragic $38,047 |
| Potawatomi | 0.2 /100 | #280 | Tragic $38,046 |
| Immigrants | Dominica | 0.2 /100 | #281 | Tragic $37,952 |
| Immigrants | Laos | 0.1 /100 | #282 | Tragic $37,857 |
| Pennsylvania Germans | 0.1 /100 | #283 | Tragic $37,842 |
| Africans | 0.1 /100 | #284 | Tragic $37,785 |
| Guatemalans | 0.1 /100 | #285 | Tragic $37,766 |
| Central American Indians | 0.1 /100 | #286 | Tragic $37,699 |
| Dominicans | 0.1 /100 | #287 | Tragic $37,697 |
| Blackfeet | 0.1 /100 | #288 | Tragic $37,695 |
| U.S. Virgin Islanders | 0.1 /100 | #289 | Tragic $37,589 |
Demographics Similar to Immigrants from Honduras by Per Capita Income
In terms of per capita income, the demographic groups most similar to Immigrants from Honduras are Ute ($36,651, a difference of 0.040%), Fijian ($36,690, a difference of 0.070%), Chippewa ($36,631, a difference of 0.090%), Immigrants from Latin America ($36,823, a difference of 0.43%), and Immigrants from Haiti ($36,849, a difference of 0.50%).
| Demographics | Rating | Rank | Per Capita Income |
| Shoshone | 0.1 /100 | #302 | Tragic $37,072 |
| Paiute | 0.1 /100 | #303 | Tragic $37,066 |
| Hondurans | 0.1 /100 | #304 | Tragic $37,031 |
| Inupiat | 0.1 /100 | #305 | Tragic $36,999 |
| Immigrants | Haiti | 0.0 /100 | #306 | Tragic $36,849 |
| Immigrants | Latin America | 0.0 /100 | #307 | Tragic $36,823 |
| Fijians | 0.0 /100 | #308 | Tragic $36,690 |
| Immigrants | Honduras | 0.0 /100 | #309 | Tragic $36,665 |
| Ute | 0.0 /100 | #310 | Tragic $36,651 |
| Chippewa | 0.0 /100 | #311 | Tragic $36,631 |
| Chickasaw | 0.0 /100 | #312 | Tragic $36,475 |
| Bahamians | 0.0 /100 | #313 | Tragic $36,427 |
| Seminole | 0.0 /100 | #314 | Tragic $36,180 |
| Yaqui | 0.0 /100 | #315 | Tragic $36,112 |
| Choctaw | 0.0 /100 | #316 | Tragic $35,999 |